About the Planning Board
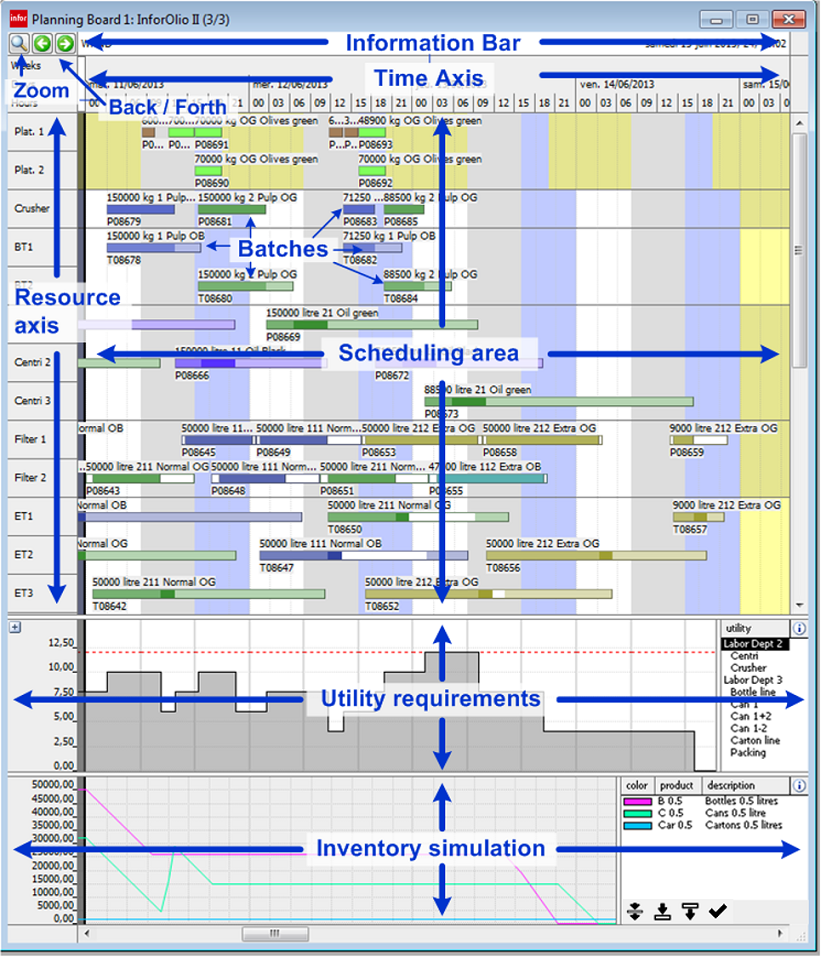
The planning board is the heart of interactive scheduling in Infor Production Scheduling; it is not just a visual presentation of the database. Its user-defined Gantt chart-like views show, in detail, the utilization of resources (shown vertically) in time (shown horizontally) in the form of batches (shown as segmented rectangular blocks). Single and/or multiple batches can be generated and changed automatically using the scheduling functions and manually using the mouse. The Planning board also includes an inventory simulation and a utility requirements graph. Symbols, colors, and text provide information about products, quantities, batch numbers, time segments, time links, and custom fields (for user-defined data). A button allows you to zoom in and out.
Using Panes Together
Here is an example of how the various panes can be combined to provide informative displays:
Opening Extra Planning Boards
To open extra planning boards, press and hold the Alt key while selecting . This can be useful if you want to view different periods. You might want to open a planning board in the quick zoom mode and a planning board zoomed in on the work area.
Superscroll
Press and hold the Ctrl + Shift keys and drag in the planning board.
Information Bar
The information bar is a text area at the top of the planning board that displays resource, time, and/or batch information from your cursor location. Resource and batch information are shown on the left side of the information bar, while date and time are shown on the right side.
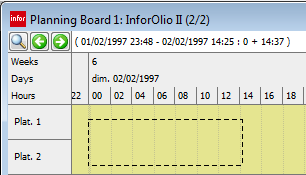
Changes in time caused by dragging batches are indicated on the left. If you select a point in the planning board (not a batch) and drag, the information bar will display the selected time span on the left, and the time covered by the selection on the right. This is handy for measuring intervals between batches.
Resource Axis
The resource axis is the vertical axis at the left of the planning board. The resource axis shows the resources that are selected in this view. Double-click a resource to open the relevant entry dialog box. You can add and remove resources as well as the horizontal divider lines, which are generally used to distinguish resource groups, in the View entry dialog box on the Resources tab.
Scheduling Area and Batches
The scheduling area is the area bounded by the horizon and the resource axis. The scheduling area shows the process and tank batches that are scheduled for the displayed resources and within the selected horizon. Modify the horizon and the work area in the time axis dialog box.

The scheduling area is the part of the Gantt chart that is visible on the screen. The schedule can cover a longer horizon and more resources than are visible in the scheduling area. You can view other parts of the schedule by scrolling through the planning board. This section contains information about the scheduling area, batches, and ways of manipulating them manually. The most efficient way of finding out how to use automatic scheduling functions is to consult the explanations in the menu and the menu.
You can view the maximum duration of a tank batch. The maximum duration is taken from the resource or from the tank batch.

You can use non-Western characters in descriptions and remarks. These characters are displayed in the planning board.

Selecting Batches
Batches are selected or not selected according to standard interface conventions and are maintained independently of your zoom status or the visibility of particular parts of your scheduling area. Pressing the Ctrl + "A" keys selects all process batches in the planning board. Dragging over or clicking resources selects all batches on them within the work area, and dragging over or clicking areas of the time axis performs a similar function. You can simultaneously drag and drop multiple batches on the same resource, even if they have been created from different process steps.
When you switch between planning board views, the batch selection between views is maintained.
Adding and Removing Availability Exceptions
You can add or remove availability exceptions on the planning board. While holding down the Ctrl + Alt keys, double-click on the relevant area of the planning board.
Signaling Icons
Various icons may show on a batch on the planning board. Each icon indicates something different. There is a complete list available of signaling icons and their meanings.
Inventory Simulation

The inventory simulation is a graphical representation of the inventory levels of materials. You can add or remove it from a planning board view in your view definition. You can change the content of the simulation by selecting a set. By defining a view with both a resources pane and an inventory simulation pane, you can schedule process batches (using or providing decoupled products) and see the results of your actions on the inventory levels in real time. Solid red lines represent minimum and maximum inventory, and a dotted red line represents standard inventory if you define a variable inventory level with the cover period. A fixed standard inventory level will not be shown in the graph.
This example shows how two batches of empty cans are delivered to Platform 3 just in time to satisfy the need for packaging material caused by the production batch on Canning Line 1.
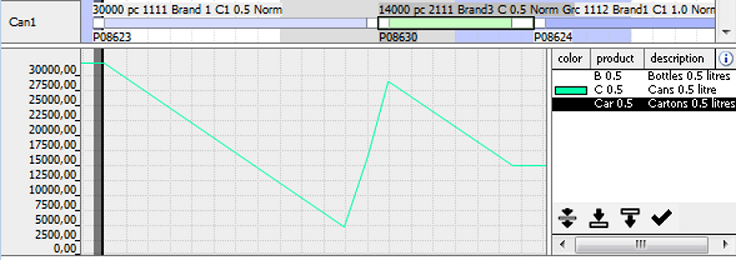
When you hover over the inventory graph, the graph pointer snaps to the nearest graph line.

From the inventory simulation, you can highlight, on the planning board, the batches that contribute to the selected inventory points at specific times:
- To highlight the batches that contribute to an inventory point for a point in time: while holding the ALT key, click the inventory point.
- To highlight the batches that contribute to an inventory point for multiple points in time: while holding the ALT and SHIFT keys, successively click the inventory points.
In the inventory simulation on the planning board, you can highlight the planned inventory batches for the selected products. In the right pane of the inventory simulation, you must select at least one product, and click one of these options:
 : Click this
option to highlight the inflow and outflow batches.
 : Click this
option to only highlight the inflow batches.
 : Click this
option to only highlight the outflow batches.
The
( ) option enables quick inventory point selection
whereby only the graphs of the selected inventory points are automatically
displayed; the rest of the graphs are not displayed. When this option is not
selected, you have to double-click an inventory point to display or hide an
inventory graph.
Utility Requirements
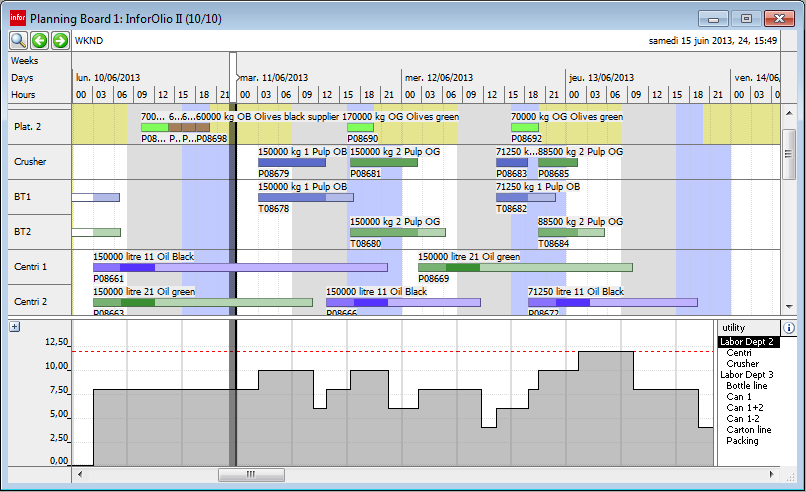
The utility requirements simulation is a graphical representation of the utilities needed for production. It is based on the scheduled batches, their utility requirements, on shift times, and on the number of workers needed to operate the resources defined in your time periods. If you cannot see this graph in your planning board, then it has not been included in the view definition.
Clicking the
button opens a
list of all departments with their process groups:

Clicking the
button on the left
opens an information bar giving details of the utilities required per shift:

A solid red line indicates the utility is a critical utility. A dotted red line indicates a non-critical utility.
Routing Constraints in the Planning Board
If you try to drag a batch to another resource, a spliced red bullet indicates resources that would make the batch violate routing constraints.

