Data Flow Tab
The Data Flow tab provides a visual representation of the data sources loaded into Birst and the corresponding user data store star schema created by Birst. You can perform data modeling tasks on this page and on the Manage Sources tab. To access the Data Flow tab, go to Admin - Define Sources - Data Flow.
Overview
You can perform the following tasks in Admin - Define Sources - Data Flow:
- Add a new scripted ETL source, Live Access source, or inherited source
- Manage sources
- Set the primary key
- Join to a related source
- Perform a complex join to a related source (for Live Access sources and inherited sources only)
- Manage or view processed data
- Enable a source
- Ignore a source, empty a source, or delete a source
The following image is a sample Data Flow diagram showing the Northwind database after it was uploaded and processed by Birst in an Automatic space.
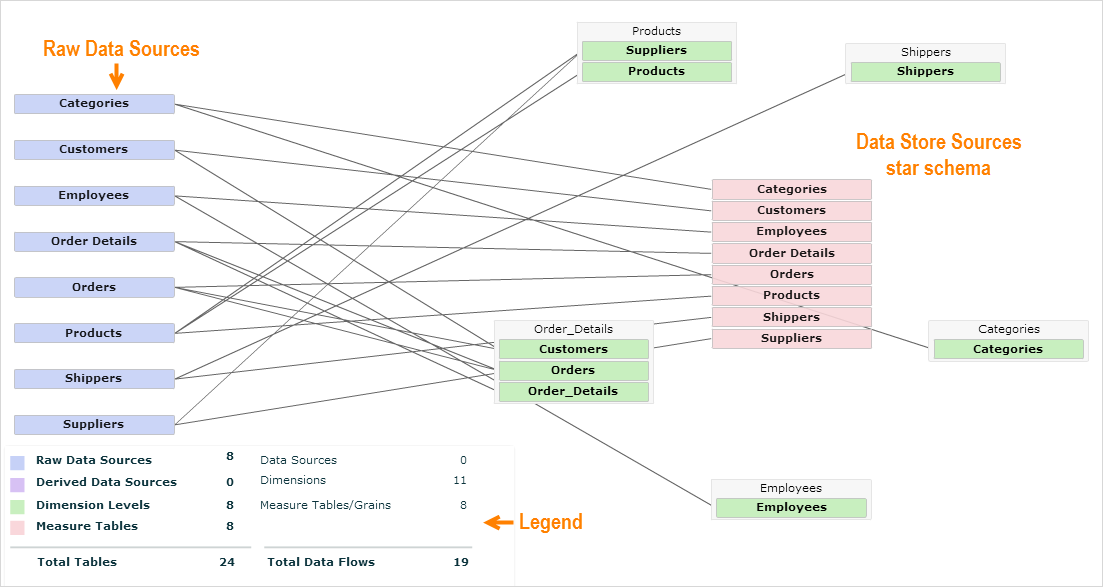
The Data Flow tab color-codes the diagram according to the Legend. The raw data sources line up on the left side. In an Automatic or Advanced space, after processing, the star schema of the user data store is on the right side. A Discovery space does not have a user data store so in that case you would only see the raw data sources.
The measure (fact) tables are in the middle and the dimensions are arranged around the measures. Lines connecting the raw data source to the star schema shows the connections, also called the "data flow", between them.
Click a raw data source to see only its connections to the star schema. You can do the same by clicking a measure or dimension. Ctrl-click multiple objects of the same type to see multiple data flows.
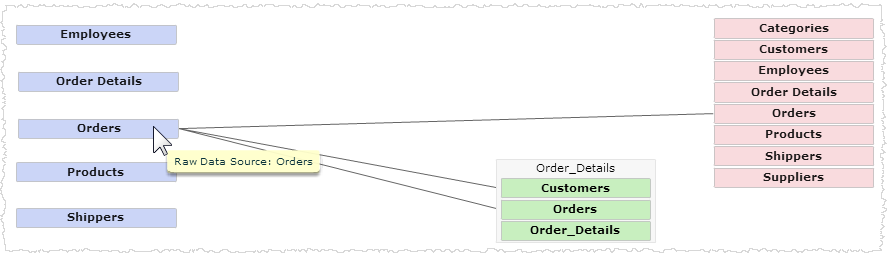
When you click an object or objects, the Filter control in the tool bar shows the filters. Click the X to deselect the filter or filters and restore all of the lines.

You can drag/drop to rearrange the raw data sources and organize them as you prefer.
Right-click on
a data source to access a menu of options for the source.
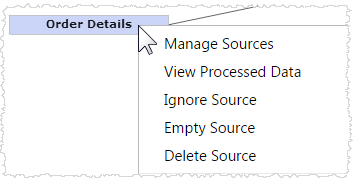
For details about these menu options for a raw data source see:
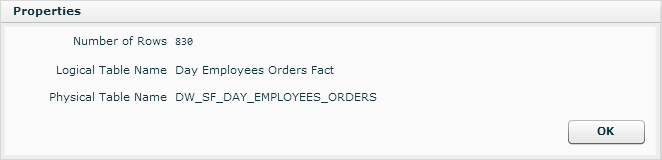
Right-click on a dimension level or measure table and select Properties to get more information.
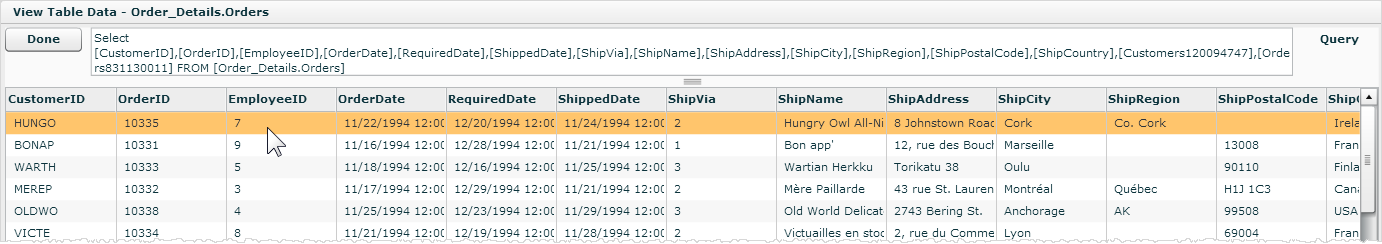
Right-click on a dimension level or measure table and select Manage Processed data to view the processed data.
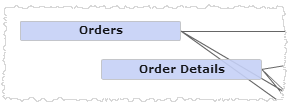
If you have already set up hierarchies and defined the grain of your data sources, Birst automatically creates join relationships between sources with matching key columns. If you have not created hierarchies and defined grains, you can create joins in the . See Setting Up Joins. A join is indicated by a line connecting two data sources.

Tool Bar
|
Use This... |
To... |
|
|
Important: Do not use this option if you have defined hierarchies and grains for your sources. Update the warehouse model. Use this if you want Birst to derive a dimensional data model for your source data based on the key columns that make the data unique. Using this tool, you do not have to create your own hierarchies and grains and all modeling is performed from the Data Flow page. See Creating a Data Model and About Update Warehouse Model for more information. After you have joined sources, click this button to see a logical representation of the warehouse that Birst will build on the right side of the Data Flow page. This option is available for Advanced spaces only. |
|
|
Export the data flow diagram to PDF. |
|
|
Modify or create new hierarchies. Opens a Modify Hierarchies dialog box with the same functionality as the Hierarchies page. Use this option to modify hierarchies if you have set up hierarchies and levels on the Hierarchies page. If you have used the Set Primary Key dialog box to set hierarchies and levels, you should use Set Primary Key to make changes. This option is available for Advanced spaces only. |
|
|
Add a new source to the space: Script based source, Live Access source, or Inherited Source. This option is not available in Automatic spaces. |
|
|
Select which processing group's data sources to view: All or a specific processing group. |
|
|
To only show the data flows for a certain object (source, measure or dimension), click that object, or Ctrl-click multiple objects of the same type to see the data flows for the selected objects. The Filter control indicates the filters that are currently applied. Click the |
|
|
Search for objects in the data model. Type a string to search for objects containing the string in either the name of the object or the name of a column in the object. Only objects containing the string or objects with columns containing the string will be displayed on the Data Flow canvas. Remove the text in the Search box to cancel the search and display all objects. |
|
|
Set the zoom level. |
|
|
Refresh your view. This will reset the zoom level to the default (Fit) and remove any filters. |


 icon to clear the filters and
view all data flows.
icon to clear the filters and
view all data flows.


Side Menu Bar
The side menu bar is expanded by default. You can hide it by clicking
the  icon.
icon.
Objects
Select the type of objects to display on the data flow canvas here.
Sources - Show or hide the data sources of the space.
Warehouse - Show or hide dimensions and measures in the star schema.
Discovery spaces do not have a user data store.
Empty Levels - Show or hide empty levels.
Imported Packages - Show or
hide objects from packages you've imported.
The names of Imported objects are italicized and have an asterisk in front
of the name to identify them. For example:
Flows
Set the data flows you would like to see on the data flow canvas here.
ETL - Show or hide data flows to scripted (ETL) sources.
Dimension - Show or hide data flows to dimension levels.
Measure - Show or hide data flows to measure tables.
Dimension/Measure - Show or hide data flows between dimension levels and measure tables.
Legend - Show or hide the legend. The legend can be dragged and dropped to a different position on the canvas. The Legend corresponds to the Normal view in the Display By dropdown box.
Display By
This provides options for displaying your model.
Normal - This is the standard view.
Table Sizes - This shows table sizes (as in the example below). Green means the table size is small and as the shade progresses toward red the table size increases. Red is the largest.
Processing Time - If you select this option, a Load dropdown list will display enabling you to select a specific data load to display. This allows you to see your model in terms of processing times by a specific load. Green is the shortest processing time and as the shade progresses toward red the processing time increases. Red is the longest processing time.
Panning
Panning allows you to navigate across large models. Pan in order to see objects that are not currently displayed on the canvas because they don’t fit. To pan, click on a blank part of the canvas and drag the view around. The zoom factor that is set remains in place.
Legend
The legend is displayed by default. To hide the legend, deselect the Legend box on the left side under Flows. The Legend corresponds to the Normal display setting.
The position of the legend can be changed by dragging and dropping it to a new location.

The raw data sources, derived data sources (i.e., script-based data sources), dimension levels and measure tables in your space are displayed in the colors indicated in the legend.
Scripted
(derived) sources are represented in purple, for example:  . See Creating a Scripted
(ETL) Data Source.
. See Creating a Scripted
(ETL) Data Source.
Ignored sources
are displayed in light grey, for example:  . See Ignoring,
Emptying or Deleting a Source.
. See Ignoring,
Emptying or Deleting a Source.
The information on the right side of the legend is specific to the object that is currently selected. It shows the number of data flows from the currently selected object to data sources, dimensions and measure tables/grains, including the total number of data flows.
Setting up Joins
Creating a Scripted
(ETL) Data Source
Connecting
to and Modeling a Live Access Source
Setting the Primary Key
Defining Column Properties
Enabling Sources