Birst Product Overview
Birst provides an integrated Networked BI platform for data-driven analysis. Birst includes:
- Home: Home is the entry point for BI developers, data analysts, and administrators to work with data in Birst. Business user accounts can be configured to directly open dashboards and bypass Home.
- Dashboards: Dashboard authors create and view interactive dashboards that contain reports built in Designer and Visualizer. Business users can browse the dashboards, drill down into details, and share them via email. In addition to viewing dashboards in web browsers, end users can access them from Birst Mobile apps.
- Visualizer: Business users and report writers access Visualizer to explore enterprise data and quickly get answers to business questions.
- Designer: Data analysts and report writers use Designer to create pixel-perfect reports and charts that can be added to dashboards, printed, scheduled, and exported to other formats.
- Admin: Developers, data analysts, and administrators use the Admin interface to create and manage the user data store, report catalogs, user accounts, and access permissions.
- Application Connectors, Birst Connect, and Live Access: Birst Connectivity Framework tools provide access to data residing in other systems.
To help you get started, also see:
Birst Home
When you log into Birst
the Home page is your starting point. 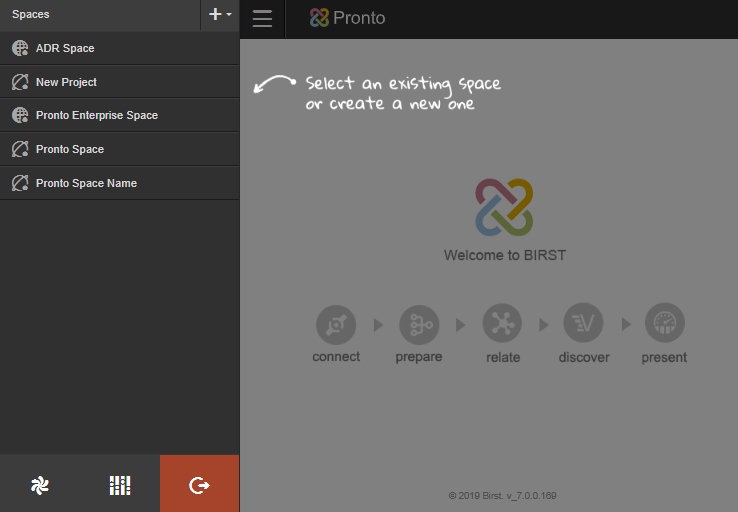
It shows the spaces, the containers that organize and hold data, metadata, reports and dashboards. An account may have one space or use separate spaces with different sets of data for different analytical purposes.
You work with the data and objects in spaces using Visualizer and Designer to create reports and Dashboards to group reports together for business users to browse their information.
Dashboards 2.0
The new generation of Birst Dashboards is based on responsive design principals and promotes highly interactive user experiences. Organize Visualizer and Designer reports onto dashboards, add powerful filters, key performance indicators (KPIs), geo maps, and text boxes, and group dashboards into collections.

For some features such as chart animations or 3-D charts use the original
version of Dashboards.
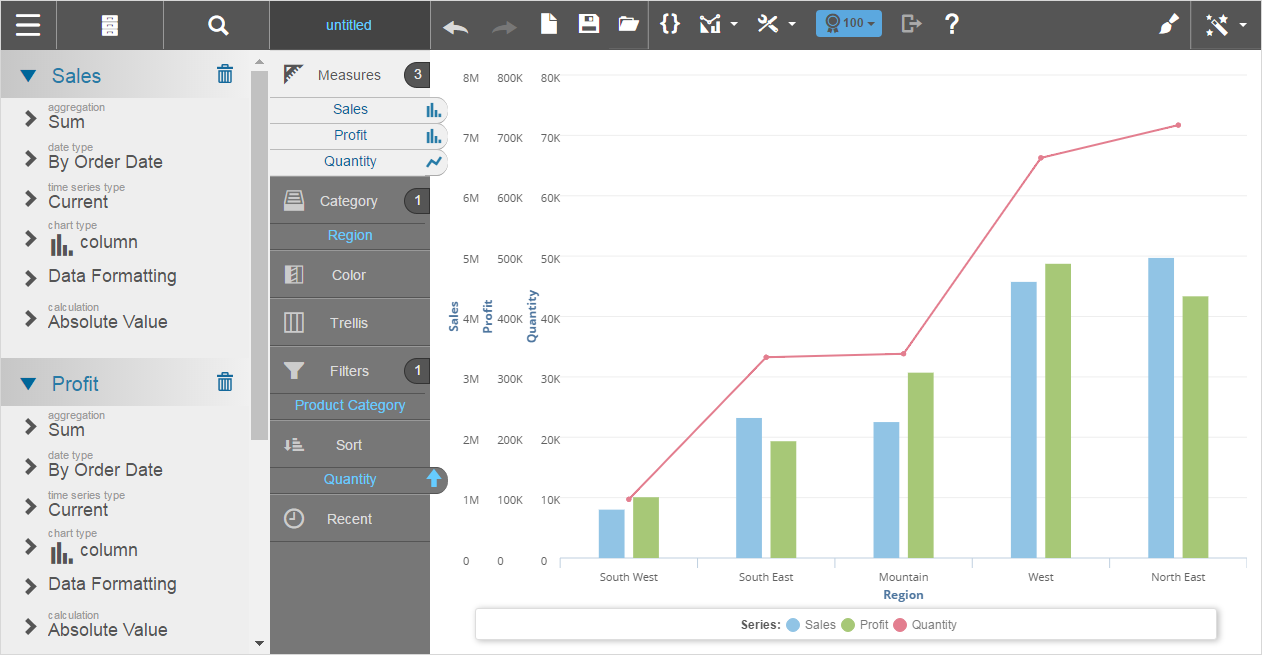
Visualizer
Visualizer helps business users and report writers to rapidly answer questions and discover information. You don't have to have formal expertise to interact with the drop-down menus and drag-and-drop columns. You can save and add reports to dashboards.
Designer
Designer provides pixel-perfect layout capabilities and advanced functionality such as column selectors and drilling. Use Designer to develop highly formatted enterprise reports that you want to print, schedule for email delivery, or export.

Admin
The Admin module provides both data and system-related operations. Access
to functionality is based on your user permissions.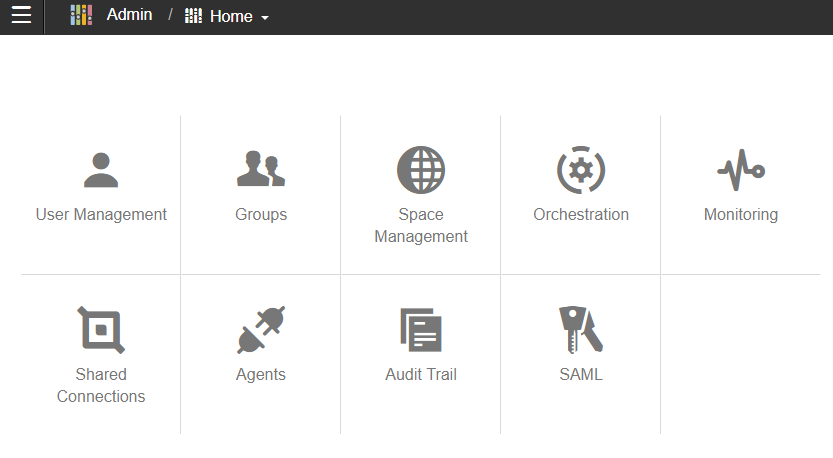
Data processed in Admin is available for analysis and reporting in Designer and Visualizer.
Connectivity Framework
Birst provides various ways of connecting to your existing data:
- Birst Connect is a Java Web Start application that automates uploading and processing data in Birst. It runs behind your firewall in order to access files and data sources at your location. Birst Connect uses HTTPS and supports JDBC data sources and SAP.
- Birst Live Access allows Birst to access data resident in local data marts and data warehouses without requiring that data to first be uploaded into Birst.
- Application Connectors provide access to many enterprise applications including Marketo and Salesforce.
- Upload Files such as Microsoft Excel, Access, or delimited ASCII text.
In addition Birst can integrate with an R Server.
Deployment Options
Infor provides customers with the following deployment options:
- Birst Cloud offers a complete multi-tenant BI solution hosted by Infor with guaranteed performance, reliability and security. You simply log in to Birst from any supported browser.
- Birst Appliance encapsulates the entire Birst BI suite as a virtual machine for deployment on premise. Thanks to its shared-nothing architecture, the appliance supports painless horizontal scalability and upgrades in place.
- Birst Embedded provides a flexible, open framework for embedding content into another application, enabling tight integration. Birst can be embedded into another application using either a cloud or appliance deployment.
- Birst Mobile provides business users with responsive dashboards on their mobile devices.
Before Using Birst
Before getting started with Birst it is helpful to have made some high-level design and scoping decisions based on the needs of your organization. Stakeholders in your organization can provide input to guide your Birst projects by answering questions such as:
- Who is your end-user audience: executives, customers, internal employees?
- What types of reports and dashboards do users need and how will they access them?
- What do they want to measure: sales, inventory, performance?
- What do they want to analyze or categorize the measures against: by time, by company, by employee?
- What data do you need to gather and analyze in order to provide the information?
- What are your data sources and where do they reside?
- How often do these data sources get refreshed?
- Who is on the team that will model the data, create reports, and compose dashboards?
- Who will require administrative access?
- What are the security requirements for your data? Do you have sensitive private data that must be protected?
Answers to these questions will help you define how to make Birst work best for your organization.
Next Steps for Using Birst
The high-level steps for setting up and using Birst are:
Depending on who you are as a Birst user, you may perform only a subset of these activities.