Creating Reports
Birst reports are charts, tables, and geomaps that make the underlying data easier for users to quickly comprehend. Well-designed reports support the business intelligence activities of the organization, such as analyzing performance, forecasting trends, or tracking inventory. Users can tell at a first glance what is the most important high-level information, and then drill into other levels of detail to get more information. Because modern reports are quite sophisticated they are also called "visualizations".
After the data in the space has been modeled and processed, use either Designer or Visualizer to create reports.
Visualizer
Visualizer is the best choice when you want to perform data exploration to uncover trends or quickly get answers to specific business questions. Account Administrators can assign Visualizer access to groups. Only users in groups that have been granted Visualizer access can see the Visualizer option on the Home page.
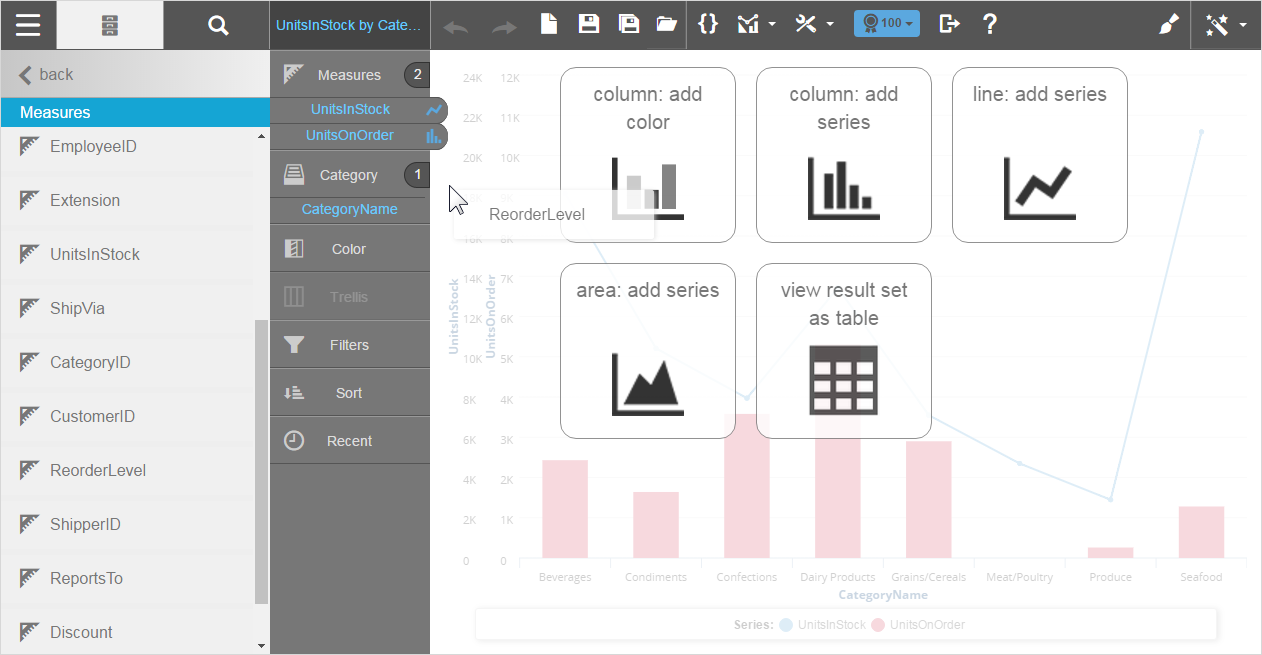
In Visualizer you drag and drop attributes and measures onto the canvas. It prompts you for appropriate chart types based on the data, and provides sophisticated filtering capabilities.
Visualizer is also available to business users who have Explore in Visualizer permission. You can enable them to browse and explore the data on their own, without waiting for assistance. The easy-to-use interface enables self-service and ad-hoc explorations.
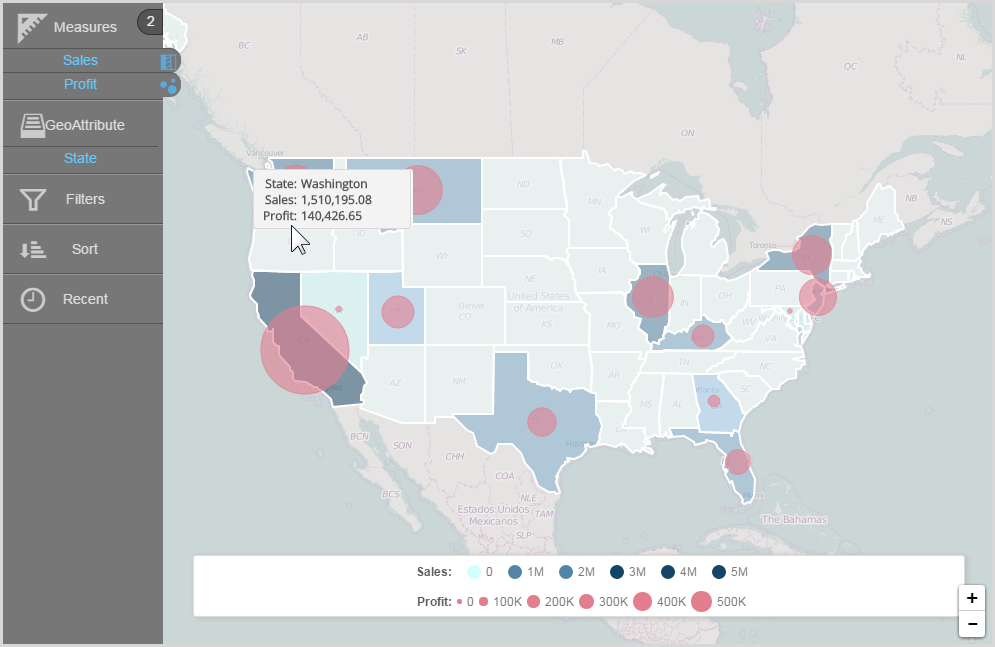
Visualizer also supports geomaps, for geographically-oriented reports.
Designer
Use Designer to develop
precisely formatted enterprise-grade reports that you want to be able
to print, schedule for email delivery, or export. On the Home page click
Designer.