Designer provides a wide variety of chart types for various purposes. Designer provides two ways to create charts:
- Create basic column, pie, line, and bar charts from the Quick Chart buttons
 .
See Adding
a Basic Chart to a Designer Report.
.
See Adding
a Basic Chart to a Designer Report.
- Create advanced charts and additional formatting options from the Add, Chart menu option as discussed in this topic.
After you create the table of a report, you can add an advanced chart to it. You can also combine more than one chart by adding multiple chart layers, for example, when you want to create a column/line combo chart.
To add an advanced chart type or to access advanced chart options when adding a new chart
- In Classic Designer, create a report or open an existing report.
- Click Add - Chart.
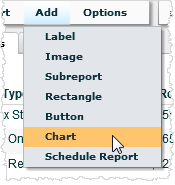
The Layer Properties dialog box opens (with the Chart Properties dialog box displayed behind). This is where you define a chart layer.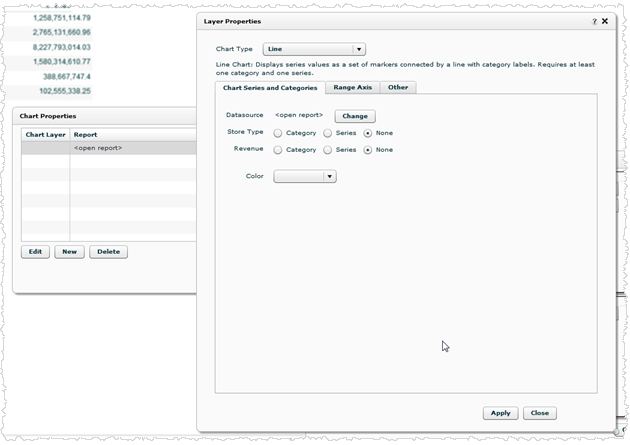
- In the Layer Properties, select a Chart Type. See Supported Chart Types.
- In the Chart Series and Categories tab, select the
categories (attributes) and series (measures) to use.
The chart will not display unless you select the minimum number of categories and series required for the chart type. - Click Apply to see immediate updates to the chart.
- Select the chart layer type settings to use in the Range Axis (y-axis) tab, such as layer axis sharing, enable/disable, location, scale, title, font formatting, line styles, labels, grid lines, etc.
- Select chart layer type options from the Other tab, such as colors, fill type, display values on/off, display value font formatting, position, rotation, tooltip format, spacing, shapes, etc. These options vary based on the type of chart.
- When you finish making changes to the Layer Properties settings, click Close. The Chart Properties lists the new chart layer.
- To change the overall chart legend, background, borders,
layout, domain axis, chart colors or header and footer, click the corresponding
button in Chart Properties.
These options apply to all chart layers. - To add another layer to the chart, click New and define the properties for the second chart layer.
- When you finish formatting the overall Chart Properties, click Close.
- Click Report - Save to save the report with the newly added chart.
Tips:
- If you want to show only the chart without the table, select Report Properties from the Options menu and uncheck Show Table.
- To change the properties of a chart at any time, right-click the chart and select Chart Properties.
See Also
Supported Chart Types
Creating a New Report
Adding a Basic Chart to
a Report
Creating Trellis Charts
Geo Map Reference
Adding
Geo Markers or Bubbles on a Geo Map or Bing Map