A chart is a graphic representation of your data. A chart can usually be read and understood more quickly than the tabular data that it is based upon. Designer provides two ways to create charts:
- Create advanced charts and additional formatting options from the Add, Chart menu option. See Adding an Advanced Chart Type to a Designer Report.
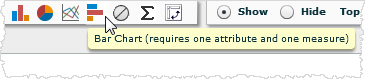
- Create basic column, pie, line, and bar
charts from the Quick Chart buttons
 as
discussed in this topic.
as
discussed in this topic.
After you create the table of a report in Designer, you can add a basic chart to it.
Designer creates a basic chart by automatically determining which columns serve as categories(attributes) and series(measures) based on the column type and order in which the columns were added to the report.
To quickly add a basic chart to a Designer report
-
In Classic Designer, create a report or open an existing report.
-
Select a chart from the Quick Chart buttons. For example, a bar chart.
Designer chooses the first attribute and first measure from the report and creates the chart. For example, Revenue per Store Type.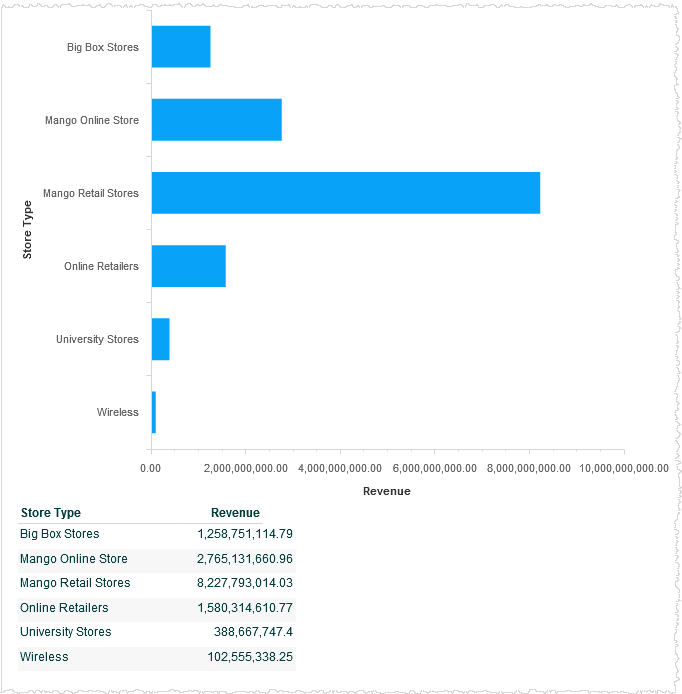
-
To change the appearance of the chart, click Options, Chart Properties and select the settings to use in the Chart Properties dialog box.
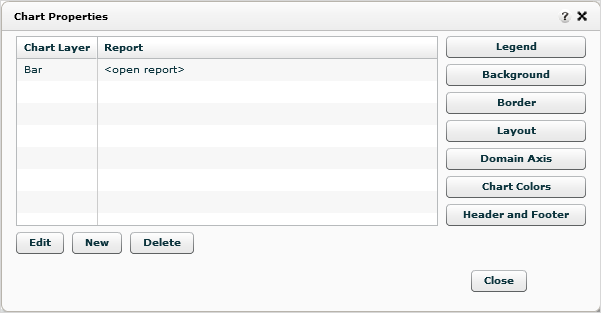
Options include:- Show/hide a legend, change its location, font formatting, show all points, etc.
- Show/hide a chart background, change a chart's or plot's color and opacity.
- Show/hide a chart border, change its color and line thickness.
- Change the chart size, margins, orientation, add 3D and animation.
- Change the domain axis (x-axis) location, scale, title, font formatting, line styles, labels, grid lines, etc.
- Change how the chart displays colors.
- Change header, subheader, and footer labels, font formatting, and alignment.
- Click Report, Save to save the report with the newly added chart.
Tips:
- To delete the chart, click the No Chart
icon
 next to the quick chart icons.
- If you want to show only the chart without the table, click Options, Report Properties and uncheck Show Table.
- If a column is configured for drilling, you will see that behavior in the chart. See Adding Drilling Capability to a Column.
See Also
Supported Chart Types
Creating a New Report
Adding an Advanced Chart
Type to a Designer Report
Creating Trellis Charts