The Visualizer Expression Builder helps you add report-level attributes, measures, or filters based on BQL expressions. You can make these available to other reports in the same space using the Make Global option.
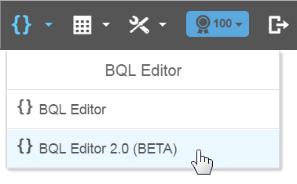
Important: In 5.26, a new version of the Expression Builder is in BETA status. It includes integrated syntax help, validation, and pretty-printing.You can access it from the same {} menu.
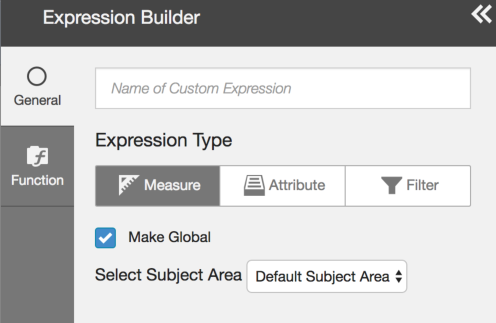
Important: In 5.27, The Expression Editor Basic mode now displays attributes and measures from multiple subject areas to build your expressions and you can now save expressions in either a Custom Subject Area or the Default Subject Area.
Tip: For Visualizer tables you can use BQL expressions to specify conditional formatting.
BQL provides many functions and operators for expressions in Visualizer. See Supported Functions and Operations in Visualizer Expressions.
The Expression Builder supports a visually-oriented Basic mode and a text-oriented Advanced mode. In Basic mode, the Expression Builder provides type-ahead search to make it easy to add columns, operators, and functions. Use Advanced mode when you want to type a new or copy-paste an existing BQL expression.
Tip: Some functions are supported only in Advanced mode. See Supported Functions and Operations in Visualizer Expressions.
Expressions you create are available in the Visualizer Subject Area and you can use them like any regular measure or attribute.
Important: By default report expressions created in Visualizer
are only available for the current report; they are not available for
use in other reports. You can make an expression available across the space by clicking Make Global. This is also called a "saved expression".
Saved expressions that have been created in Designer can also be used in Visualizer reports.
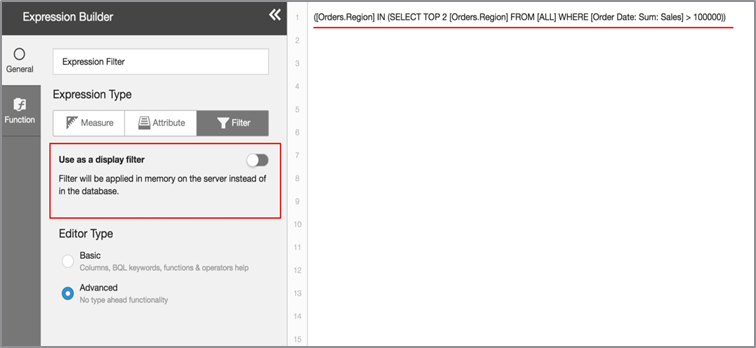
Expression filters are display filters and apply against the query result set in memory.
To create an expression in Expression Builder
- In the Visualizer
module, click Expression Builder
 .
The Visualizer Expression
Builder opens.
.
The Visualizer Expression
Builder opens.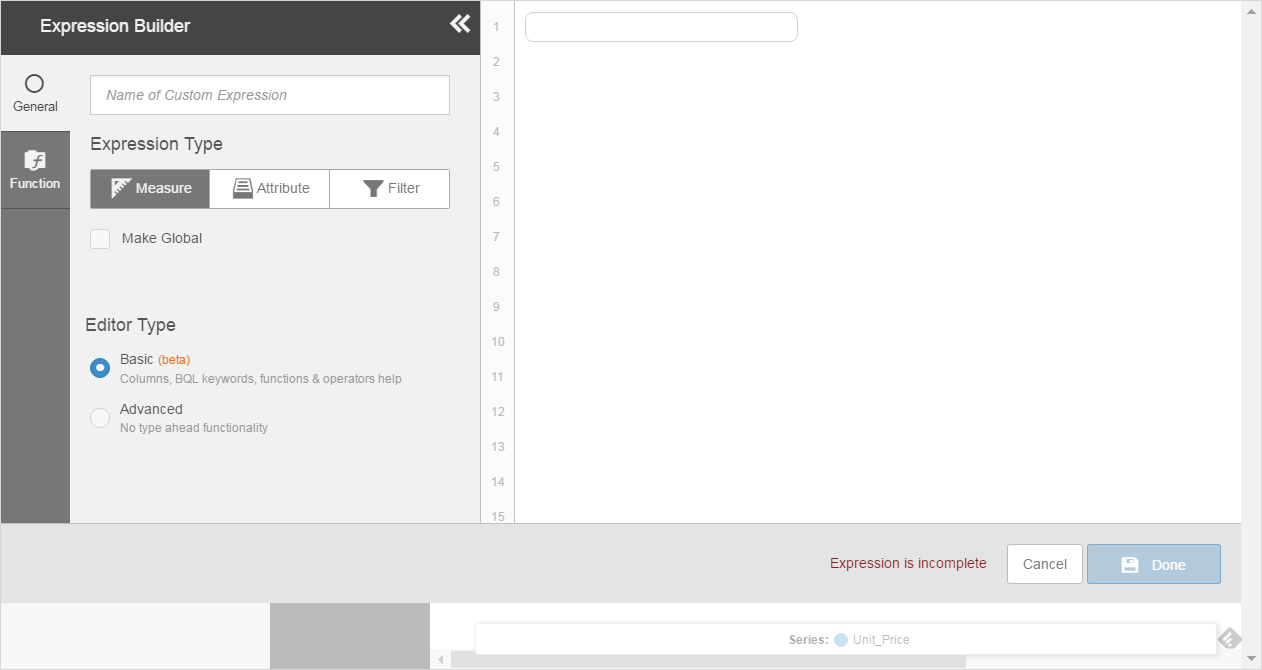
- Name the expression. For example, Revenue Expression, a measure that multiplies two existing measures.
- Select the
expression Category, either Measure, Attribute,
or Filter. For
Revenue Expression, select Measure.
- To make an attribute or measure expression available to other reports in the space, click Make Global. These are like "saved expressions" and are listed in the Subject Area for other reports in the space.
- Filter expressions can be either display filters (applied to the data in memory) or data filters (applied to the data in the database). Data filters can be leveraged for set-based filters.
- If you are
proficient in BQL or have a pre-existing query, select Advanced mode.
Enter or paste the query into the text field and click Done.
Tip: Use the Functions Reference tab to find the syntax for Advanced mode functions.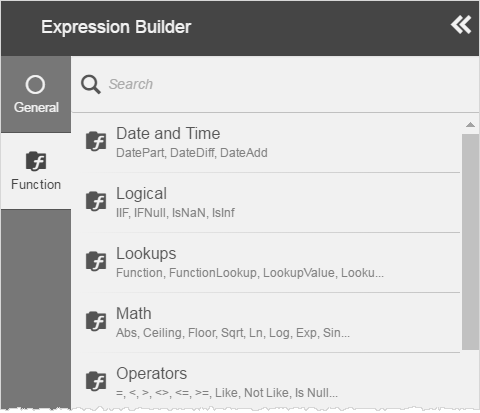
In Basic mode, start typing the name of one of the existing measures the Code field. For example, Quantity. Visualizer provides type-ahead search finds the relevant measures. Select the Quantity measure.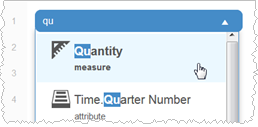
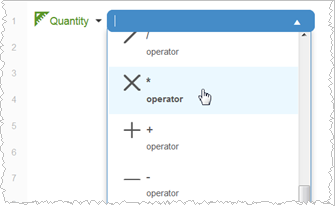
The message "Expression is incomplete" displays at the bottom and Done is unavailable until there is a complete expression in the Code field. - Visualizer
presents a list of useful operators. Select the operator from the list
or type a shortcut such as asterisk (*).
- Start typing
the name of the next measure and select it. For example, Unit Price.
The editor prompts for additional clauses you may need. This example does not require more.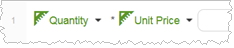
- Click the
dropdown arrow next to a measure to add Aggregation and By Date information.
For example, Quantity uses the defaults Sum and By Order Date.
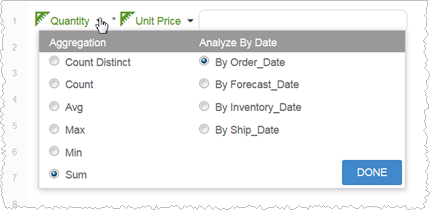
- For Unit Price, select Avg and leave the default By Order_Date.
- Click Done. Visualizer saves the expression and closes the Expression Builder.
To use an Expression Editor expression in Visualizer
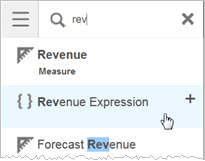
- To find an
expression search for it in either Measures or Attributes in the Subject
Area.
- Add the expression
to your report as you would any other measure or attribute.
Tip: You can use an expression as a filter by dragging it to the Filters bucket. - Click Save
 .
.
Tip: To edit or delete an expression, navigate to the expression in the Subject Area and click Add (+).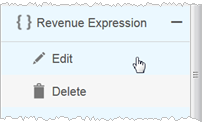
To use a Designer expression in Visualizer
Important: You cannot filter the data in a Visualizer report using a report expression created in Designer.
- Click Other
Expressions in the Subject Area to view expressions created in Designer.
If no saved expressions exist for this space, Visualizer does not display the Other Expressions folder. - Double-click
the expression to add it to the report or drag and drop it to the Chart
Builder.