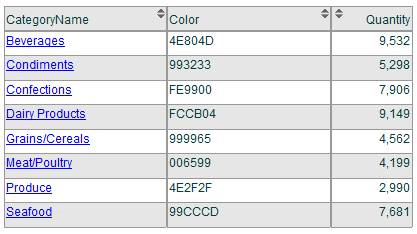
To use consistent chart colors for specific attribute values, you can add a column to your report that provides the color values. For example, a report where the attribute Color provides the hex color value for each product category.
Tip: Color names such as "green" or "red" can also be used for the color value.
There are two ways to create the Color attribute:
Create a custom expression for a column in your report to provide color values in Designer.
Create a custom attribute in Customize Space (if you have Admin access).
If you create a custom attribute in Customize Space for chart colors, that attribute will be available in your Subject Area to use over and over again for as many reports as you want. If you create a custom expression for a column in your report, it will only apply to that report.
Tip: You can define custom colors for Bing map markers for use in the HTML5 version of Dashboards, however, the custom colors will not be displayed in the standard version of Dashboards.
To create a custom expression in a report to define chart colors
| 1. | Create a report with a chart in Classic Designer. |
| 2. | To specify the color to use in the chart for each attribute value (in our example, each product category in the CategoryName column) add the same column to the chart again. (Using the example of CategoryName, the second instance of the column would be called CategoryName_2.) |
| 3. | Rename the column header of the duplicate column
to Color by clicking the column
and selecting Label Properties. Type Color in the Header Label field. Tip: The name of the column can be anything you like; it does not have to be Color. |
| 4. | Click the column header of the Color column and select Column Properties. The Column Properties dialog box opens. |
| 5. | Type a custom expression in the Expression box to
assign a specific hex color value, or a color name such as "green"
or "orange", to each attribute value. For our example it would
be: IIF([Products.CategoryName]='Beverages','4e804d', IIF([Products.CategoryName]='Condiments','993233', IIF([Products.CategoryName]='Confections','fe9900', IIF([Products.CategoryName]='Dairy Products','FCCB04', IIF([Products.CategoryName]='Grains/Cereals','999965', IIF([Products.CategoryName]='Meat/Poultry','006599', IIF([Products.CategoryName]='Produce','4e2f2f', IIF([Products.CategoryName]='Seafood','99cccd','ccccc')))))))) |
| 6. | Click Save. The color values will be displayed in the Color column of the report table. |
| 7. | Select Options, Chart Properties. Select the chart and click Edit. In the Color dropdown in the Chart Series and Categories tab of the Layer Properties dialog box, select the Color attribute. |
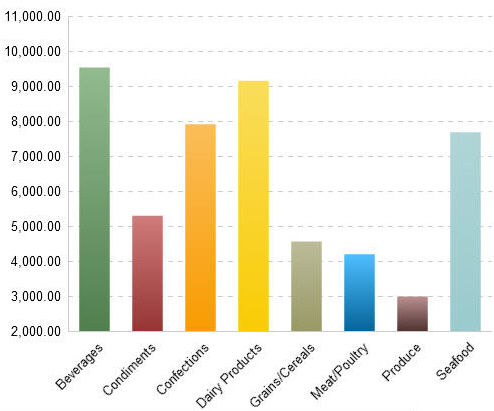
| 8. | Click Apply, then Close in the Layer Properties dialog box. Click Close in the Chart Properties dialog box. You will see the chart colors as defined in the Color column (as in the example below). |
To create a custom attribute to define chart colors
| 9. | In the Admin module, click the Customize Space tab, then click Custom Attributes. |
| 10. | Click the Create button to create a custom attribute. The Add Custom Attribute dialog box opens. |
| 11. | Type "Color" in the Name field and select the column (in this example, Products.Category) in the Apply To list. |
| 12. | In the Formula field, type the formula to use. For
our example you would type: IF [CategoryName]='Beverages' THEN '4E8040' IF [CategoryName]='Condiments' THEN '993233' IF [CategoryName]='Confections' THEN 'FE9900' IF [CategoryName]='Dairy Products' THEN 'FCC804' IF [CategoryName]='Grains/Cereals' THEN '999965' IF [CategoryName]='Meat/Poultry' THEN '006599' IF [CategoryName]='Produce' THEN '4E2F2F' IF [CategoryName]='Seafood' THEN '99CCCD' END Tip: You can also specify a color name instead of a hex value, for example: "green" or "orange". |
| 13. | Click OK. The new custom attribute will be listed on the Custom Attributes page and will now be available for use in the Subject Area of Designer. |
| 14. | In Designer, create a report with a chart and add the Color attribute to your report. |
| 15. | Click Options - Chart Properties. |
| 16. | Select the chart and click Edit. In the Color list in the Chart Series and Categories tab of the Layer Properties dialog box, select the Color attribute. |
| 17. | Click Apply, then Close in the Layer Properties dialog box. |
| 18. | Click Close in the Chart Properties dialog box. You
see the chart colors you assigned in the Color attribute in your chart. |
See Also
Creating a New Report
Adding a Basic Chart to
a Report
Creating Custom Attributes