Column selectors let business users change attributes, measures, or both, of a chart or table in Dashboards 2.0. Column selectors allow your reports to become very versatile. For example a report with column selectors can:
- Apply different attributes that are not related in a hierarchy.
- Provide an alternative way to drill down or up through a hierarchical set of attributes.
- Apply different measures to the same attribute.
Column selectors can reduce the number of reports needed on a dashboard by allowing a single report to do the work of multiple reports.
 Watch: Column Selectors in Action
A column selector applies to a set of attributes and/or a set of measures. You can mix attributes and measures in a column selector. Set up the column selectors in your Visualizer report for use in Dashboards 2.0.
To create a column selector report
- Add an attribute and a measure to the report.
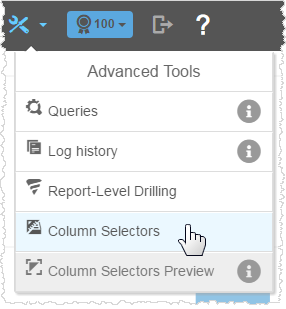
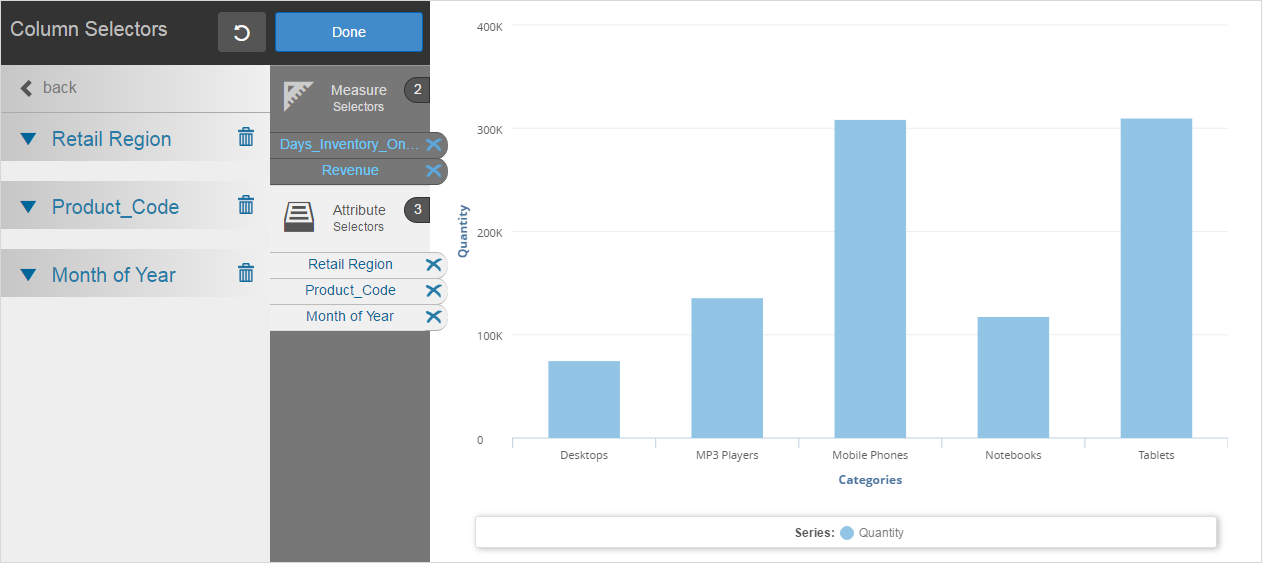
- Click Advanced Tools - Column Selectors.
- In the Column Selectors panel, drag and drop an attribute or measure onto the corresponding bucket.
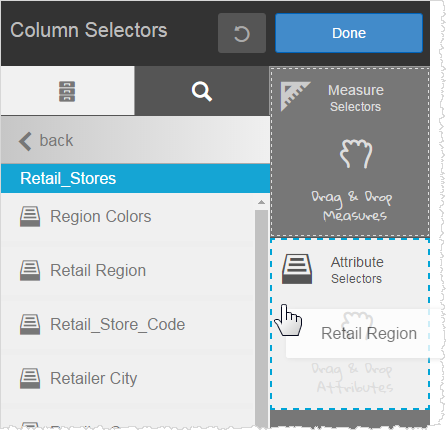
The panel updates with the new selector. - Optionally, click Back to go to the list and add more attributes or measures.
Tip: Remember that the original chart already had at least one attribute and one measure. You do not have to add them as column selectors.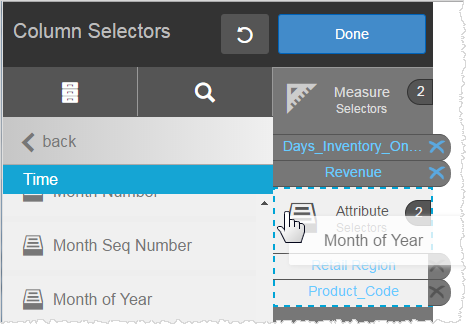
Tip: Click the X to delete an attribute or measure from a bucket. - Click Done.
-
- Click Save.
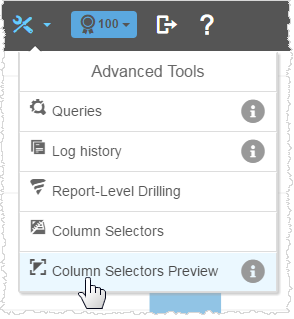
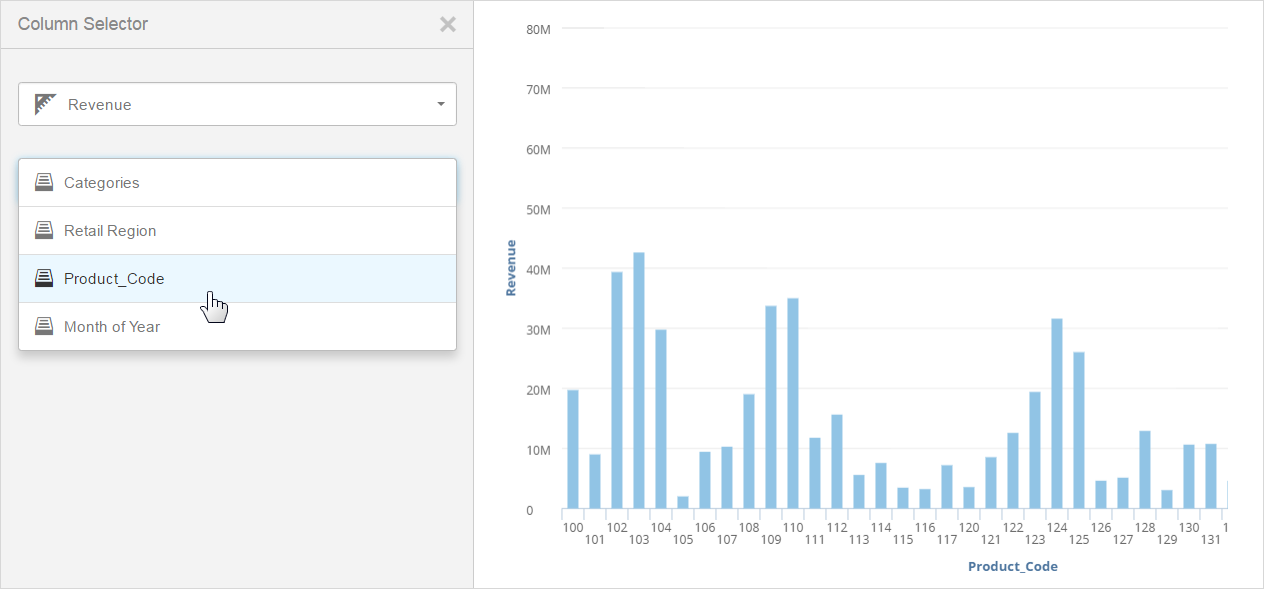
- Click Advanced Tools - Column Selectors Preview to see the new selectors.
- Test out the column selectors. Iterate to make changes if needed. Click X to go back to Visualizer.
Next Steps
Add the report to a Dashboards 2.0 dashlet and save the dashboard.
When business users access the dashboard, they can click Dashlet Actions - Column Selector and toggle the attributes or measures to update the report.