Use the Layout tab in Classic Designer to create highly formatted print-ready reports that are often referred to as banded reports or pixel-perfect reports. A banded report page is divided into several horizontal areas called bands. The following report elements can be positioned on a band: column, label, image, button, rectangle, subreport.
When working in the Layout tab, switch to the Results tab to see the results of your changes.
See examples of horizontal and vertical report layouts.
To change the layout of a banded report
| 1. | In Classic Designer,
open the report you want to work with or create
a new report. Tip: Before using the Layout Tab, add all the columns to the report that you need and save a copy of the report. |
| 2. | Click the
Layout tab. In Layout mode you see the report elements displayed on bands.
Label elements are labeled with a l:
and columns are labeled with a c:.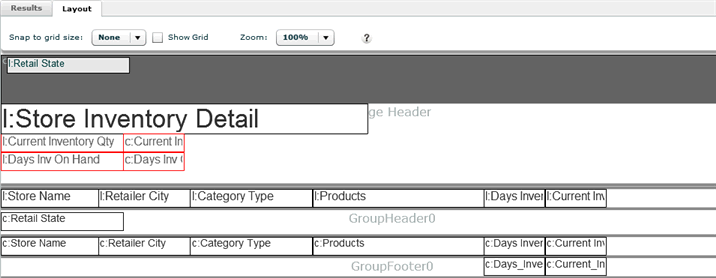 When you add a column from the Subject Area to a report, Birst automatically creates a header, or label, for it. The label is automatically placed on the Header band, while the column itself is placed below the header on the Detail band. Columns in the dark gray band at the top (ColumnArea) are included in the report query but will not be visible in the report. |
| 3. | Drag the elements
to reposition them. Tip: Click Show Grid and set Snap to Grid Size to 2 or 5 to easily align individual elements. |
| 4. | From the Add menu, you can add a label, image, subreport, chart, button or rectangle. |
| 5. | Click the Results tab to see the results of the layout changes. |
| 6. | Click Report - Save. |
Tip: To undo all layout changes and revert back to the standard table view of a report, select Options - Undo Layout Changes.
About Report Layout
Moving Elements in the
Layout Tab
Copying Elements in the
Layout Tab
Applying
Changes to Multiple Elements in Layout Mode
Adding an Image to a Report
Adding a Rectangle to a Report
Adding a Button to a Report
Adding a Sub-report to a Report
Adding a Basic Chart to
a Report
Using the Pivot Control
in Designer