Creating a Custom Time Hierarchy
Birst automatically provides time series analysis with the built-in Time dimension. See Time Attributes and Time Series Measures.
Your organization may have your own specific time attributes and time period shifts. In this case you may need to define a custom set of time attributes. You can add your own custom time hierarchy definition to a Birst data store (warehouse).
Important: Custom time hierarchies are supported only for Advanced spaces. See Space Types.
The example in the first section compares Fiscal Year/Month/Week totals. The example in the second section compares Fiscal Year/Quarter/Month by Date.
- Custom Time Comparison by Fiscal Year/Month/Week Totals
- Custom Time Comparison by Fiscal Year/Quarter/Month by Date
Custom Time Comparison by Fiscal Year/Month/Week Totals
To create and load a custom time table
- The first step in setting up a custom time hierarchy is to define a
custom time table, usually in a spreadsheet. This table requires a column
containing dates and other columns containing attributes of the dates.
For example, a table with a Date column called "Fiscal Date" and other attributes such as day/week/month names, IDs, and sequence numbers.
Important: Include any period shift columns in the table.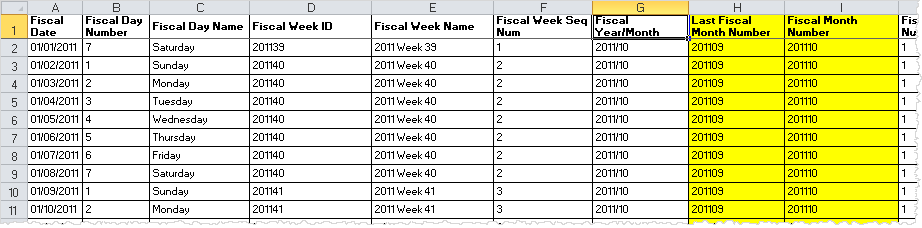
- Load the custom time table into Birst. See Uploading Flat Files.
- In Admin - Define Sources - Data Flow, enable the source. See Enabling Sources.
To create a custom time hierarchy definition (keys)
- Go to Admin - Define Sources - Manage Sources.
- Select the custom time data source from the Data Sources list.
- Click the Columns tab.
- Check
the Measure box for the lowest
grain key, for example, Fiscal Date. The Analyze By Date box should already be checked, as it is a Date field.
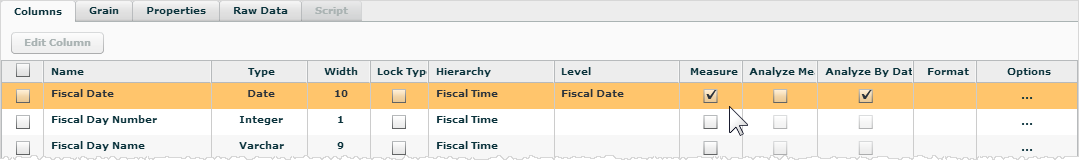
- Click Save.
- Click the Properties tab.
- Click Custom
Time Hierarchy Keys.
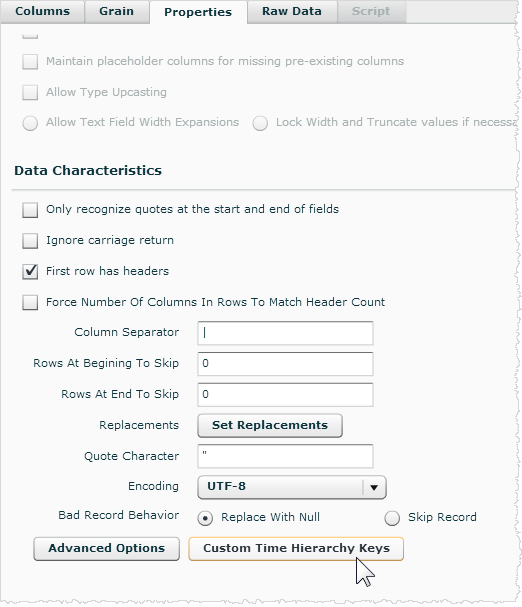
The Custom Time Hierarchy Keys dialog opens.
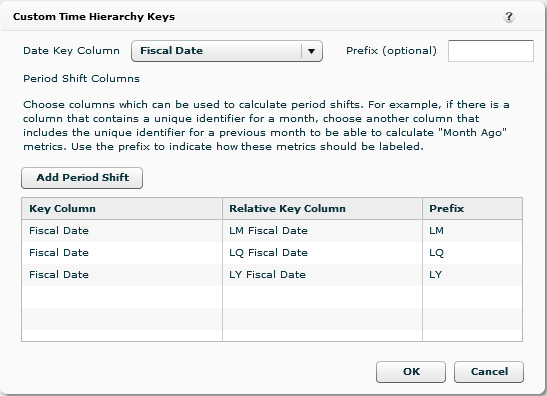
Tip: The Custom Time Hierarchy Keys button only displays for tables that have a date column. - Select the date column, for example Fiscal Date, from the Date Key Column list.
- For prior period comparison columns, such as Last Month Fiscal Date, add them as a period shift by
clicking Add Period Shift. In the Key Column, select the column
that contains the current value for the date. In the Relative
Key Column, select the column that contains the value for the other period.
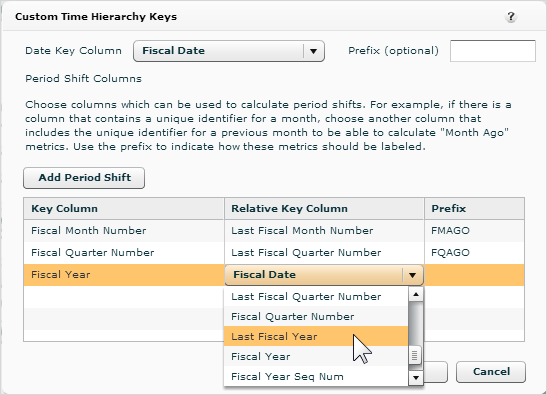
- Provide a
prefix to designate the shifted date. This allows prior periods to be compared side-by-side with current periods.
- Click OK.
- Click Save.
To create a hierarchy for the custom time
After creating the custom time hierarchy definition, create either a single-level hierarchy and a drill map, or alternatively a multi-level hierarchy. See Creating Hierarchies.
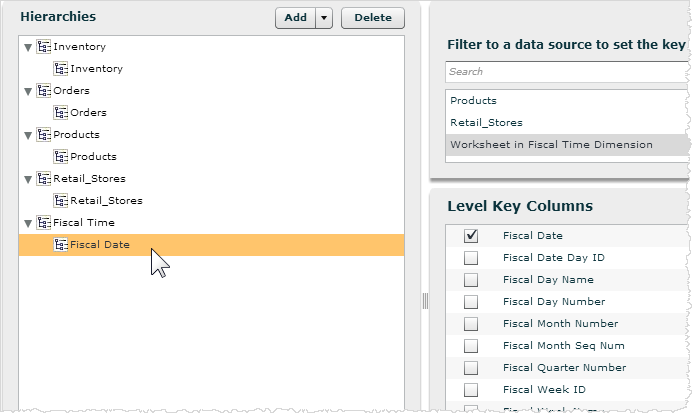
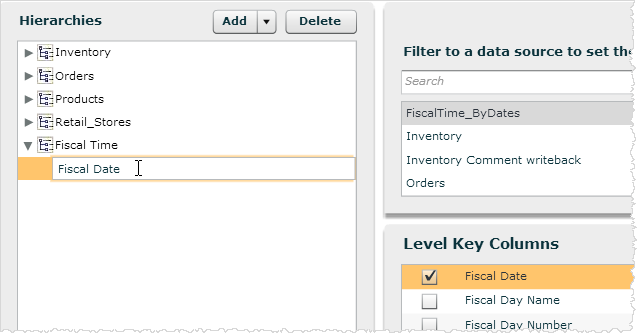
- In Admin -Define Sources click the Hierarchies tab. Add a new hierarchy for Fiscal Time and Fiscal Date. Set the level key column to Fiscal Date and save.
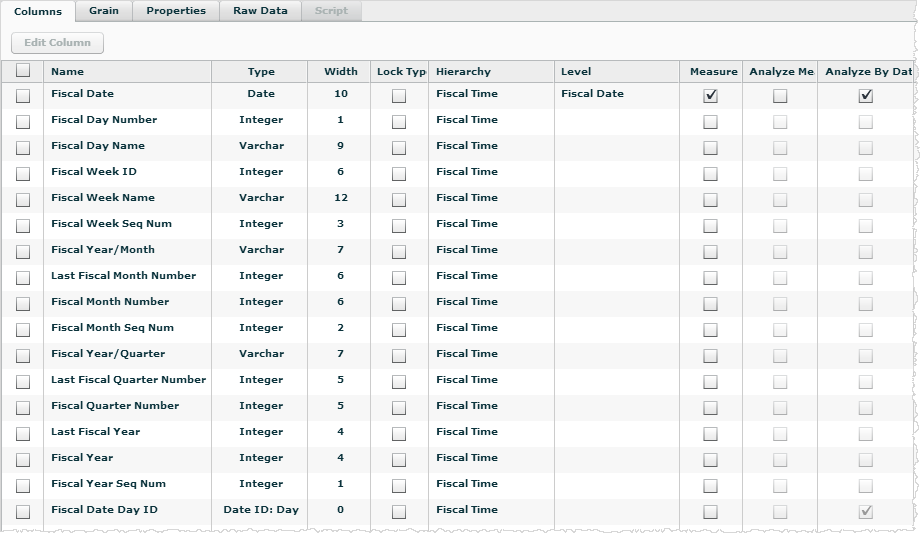
- In Define Sources - Manage Sources - Columns, target every column of the Fiscal Time table to the Fiscal Time hierarchy and set the Level of Fiscal Date to itself.
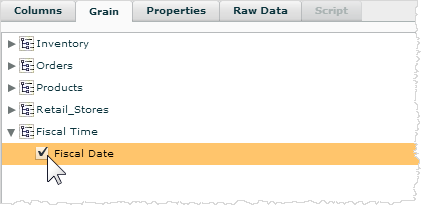
- In Define Sources - Manage Sources - Grain, set the grain to itself and save.
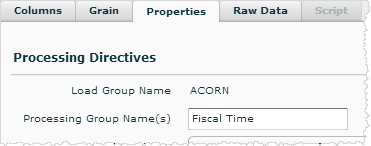
- In Define Sources - Manage Sources - Properties, add a processing group name, such as "Fiscal Time". See Setting Data Source Processing Properties. While a processing group is not required, it is a best practice.
-
Go to Admin - Process Data and process the Time data. See Processing Uploaded Data.
To create the drill map
Tip: If you use a multi-level hierarchy you do not need to create a drill map. See the alternate example.
See Creating a Drill Map.
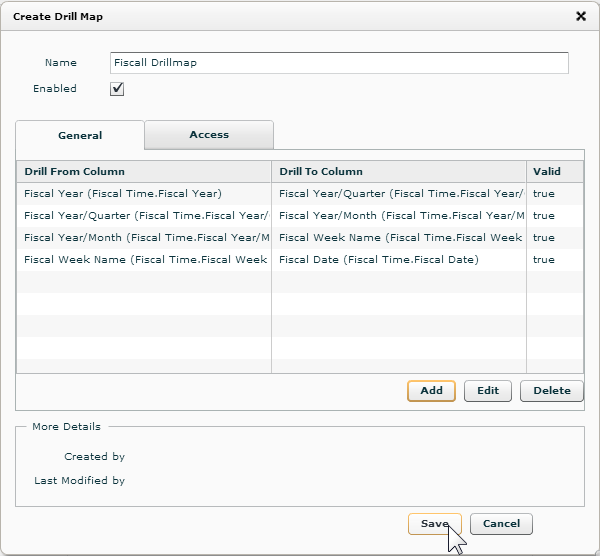
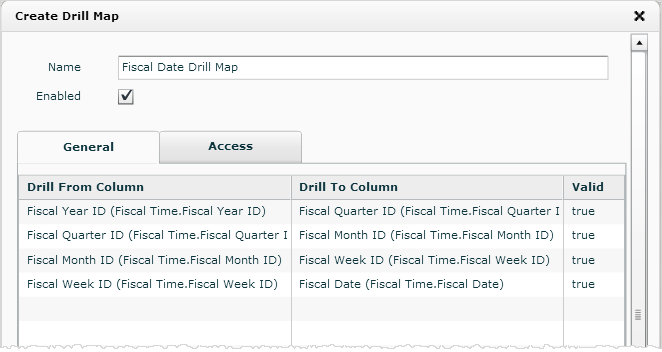
- Go to Admin - Customize Space - Drill Maps and click Create.
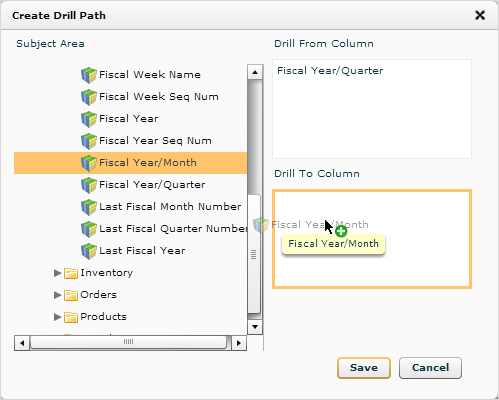
- Create the drill map and save it.
Alternate Example with a Multi-Level Hierarchy
Multi-level hierarchies are keyed on columns in the custom time hierarchy
and form the grain
of the custom time data source. In the second example, the grain is at the Fiscal Date level, but level keys
are set up for each of the upper levels. The
level key for the Fiscal Week level is set to Fiscal Week ID.
To use the custom time attributes and measures in reports
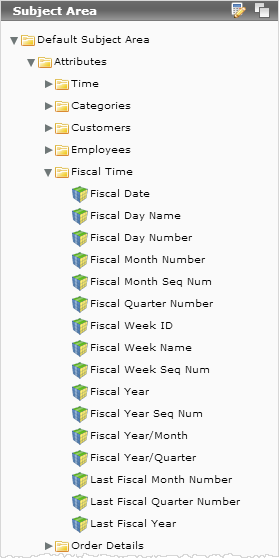
After processing, Birst lists the new attributes in the Subject Areas of Designer and Visualizer and all measures can be analyzed by your custom period shifts.
Custom Time in Visualizer
Visualizer lists the new Fiscal Time attributes and measure date types in the Subject Area.
You can use the Fiscal Year attribute with a Quantity measure with the Date Type set to By OrderDate and Time Series Type set to Current to display the current Quantity. Add another Quantity measure and change its Date Type to By OrderDate:FYAGO. Keep the Time Series Type as Current.
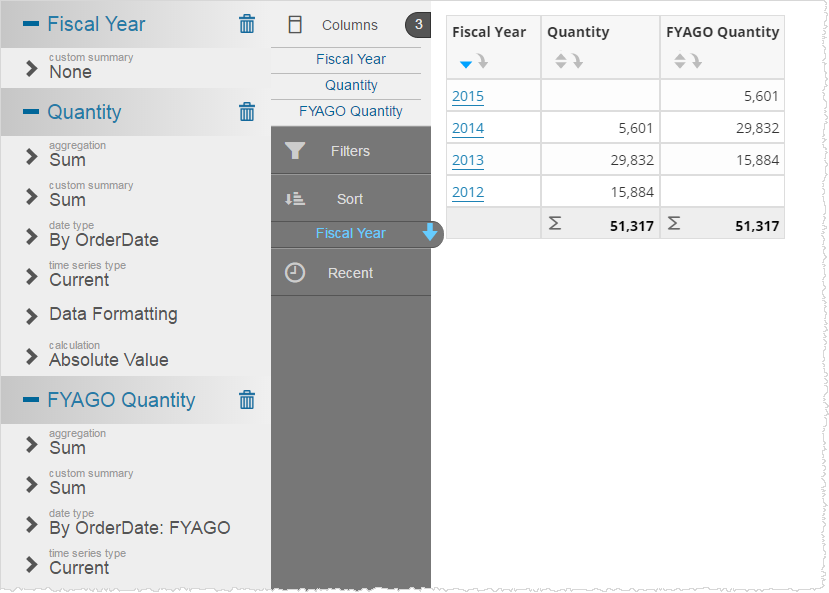
Tip: Visualize may display the Load Date, and custom time shifts based on Load Date - By FMAGO, By FYAGO, and ByFQAGO. Load Date is the date that the data was last loaded into Birst and does not provide useful insight for fiscal reporting. You would not use those attributes.

Custom Time in Designer
Designer lists, in addition to the built-in Time dimension, the new Fiscal Time dimensional attributes.
Designer also lists the new measure aggregations by time. For example, when the Order Date column is set as Analyze by Date, there are both the regular measure By OrderDate aggregations, plus the new time series aggregations.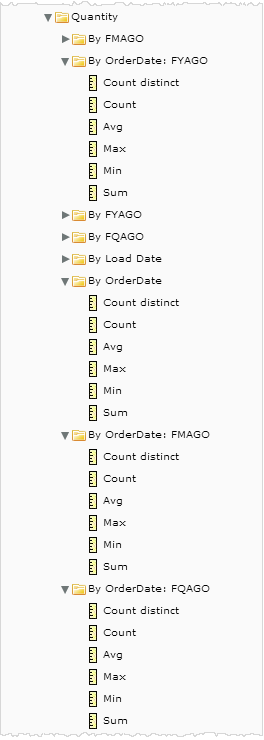
Tip: Designer displays the Load Date, and custom time shifts based on Load Date - By FMAGO, By FYAGO, and ByFQAGO. Load Date is the date that the data was last loaded into Birst and does not provide useful insight for fiscal reporting. In the example above you would not use those attributes.

Example Designer Fiscal Report
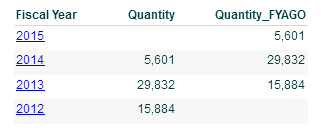
SELECT USING OUTER JOIN [Fiscal Time.Fiscal Year] 'F1',[OrderDate: Sum: Quantity] 'F3',[FYAGOOrderDate: Sum: Quantity] 'F7' FROM [ALL] ORDER BY [Fiscal Time.Fiscal Year] DESC
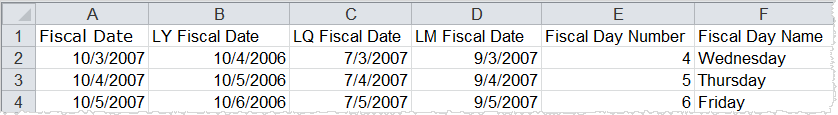
Custom Time Comparison by Fiscal Year/Quarter/Month Dates
In this example the custom time table includes the Fiscal Date, and the Last Year, Last Quarter, and Last Month Fiscal Dates. Follow the same steps as previously described.
- Upload the table and enable the source.
- In Admin - Define Sources - Manage Sources - Columns, check the Measure box for the lowest grain key, Fiscal Date.
- In the Properties tab click Custom Time Hierarchy Keys and set up the period shift keys to relate the Fiscal Date column to the corresponding Last Year, Last Quarter, and Last Month columns.
- Click OK and click Save.
- Create a single-level hierarchy with Fiscal Date as the level key.
- In Define Sources - Manage Sources - Columns, target every column of the Fiscal Time table to the Fiscal Time hierarchy and set the Level of Fiscal Date to itself.
- In Define Sources - Manage Sources - Grain, set the grain to itself and save.
- In Define Sources - Manage Sources - Properties, add a processing group name and save.
- Go to Process Data and process the new processing group.
- Go to Admin - Customize Space - Drill Maps and create the drill map.
- Use the new custom time attributes and measure aggregations in reports and dashboards.
See Also
Creating Hierarchies
Creating a Hierarchy Alias
Defining the Grain of
a Data Source