Viewing Clock Diagnostic and Status Information
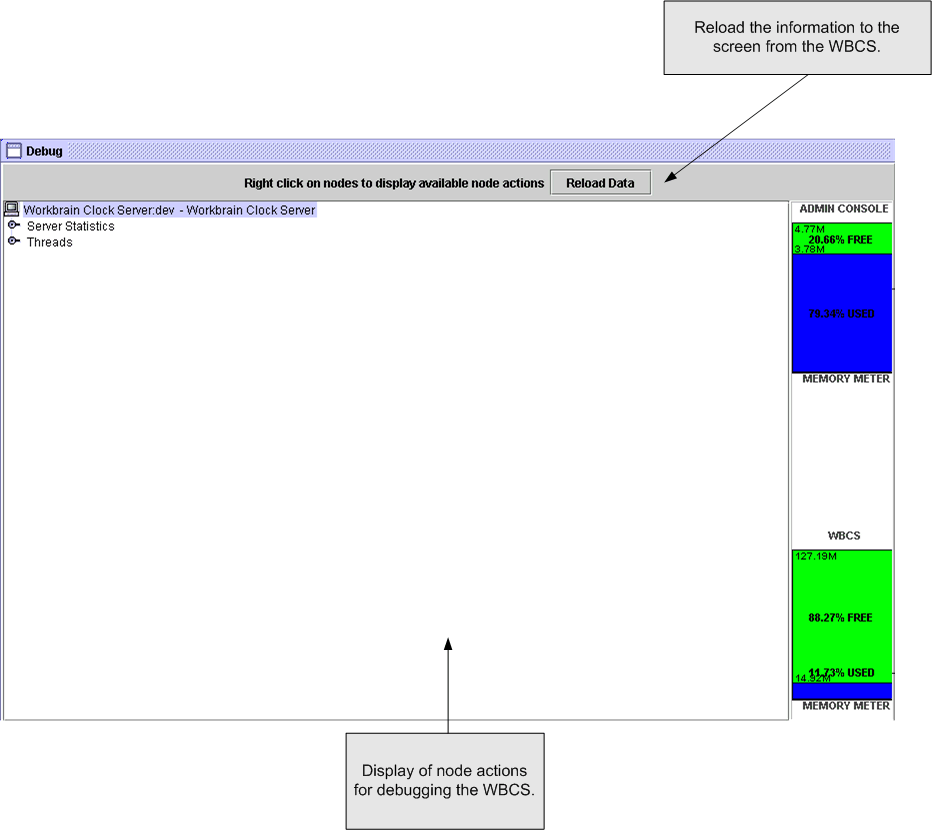
You can view diagnostic and status information for the clock server on the Debug page. The page lists two nodes: Server Statistics and Threads.
The Server Statistics node displays statistical information for the server, such as the version of the WBCS and database statistics.
The Threads node displays information about the threads that are running or can be run on the Admin Console. The three main options are: Thread statistics, Running threads, and Daemon threads.
To view the diagnostic and status information:
