Graphical Team Productivity Report
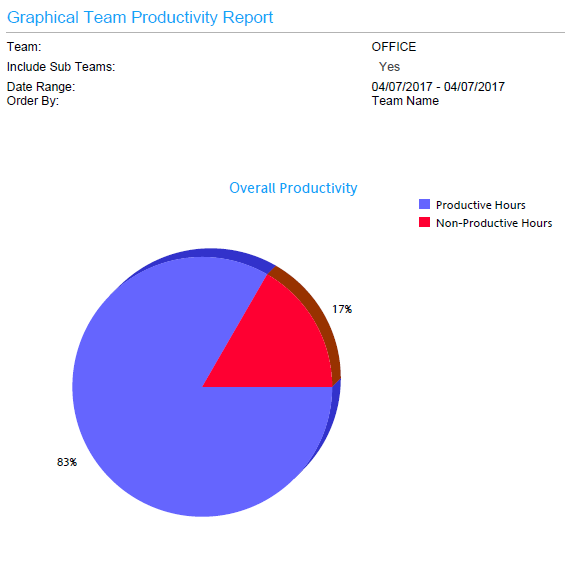
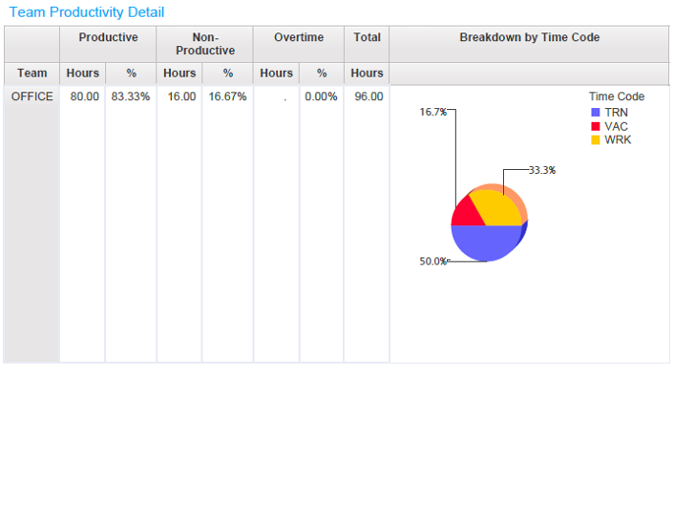
The Graphical Team Productivity report shows team productivity metrics graphically. The report aggregates work data over a user specified date interval and allows the user to choose teams for which the report should be run. Clicking on a team drills through to a separate report that shows data for sub teams.
Example output:

Example output page 2:
