Example 2: Value Change Distributed
Suppose that you want to add 1000 hours to distribute among all stores that are in mall locations. After clicking on the Worksheet, specify the following information in the Mass-Edit Criteria pop-up window:
The application performs the following calculations:
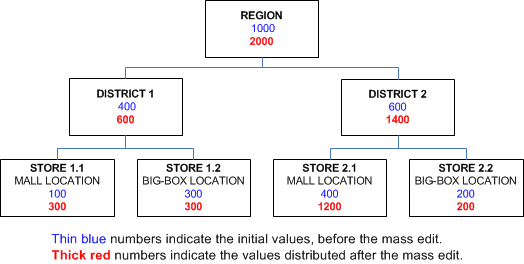
- Determines the locations that meet the filter criteria. In this example, STORE 1.1 and STORE 2.1 meet the filter criteria.
- Determines the total initial value of all locations that meet the filter criteria. In this example, STORE 1.1 has an initial value of 100, and STORE 2.1 has an initial value of 400, so the total is 500.
- Determines the total mass-edited value of all locations that meet the filter criteria. In this example, this is the initial total of 500 plus 1000, which is 1500.
- Determines how to divide
1000 proportionately among all the locations that meet the filter criteria:
-
The proportion of 1000 applied to STORE 1.1 is calculated:
(total value after mass-edit/total initial value) x initial STORE 1.1 value
= (1500/500) x 100
= 300
-
The proportion of 1000 applied to STORE 2.1 is calculated:
(total value after mass-edit/total initial value) x initial STORE 1.1 value
= (1500/500) x 400
= 1200
-
- Aggregates the values for
the stores to the parent districts. The values in the following locations
change:
-
DISTRICT 1 now has a value of 600.
-
DISTRICT 2 now has a value of 1400.
-
- Aggregates the values for the districts to the parent region. The values in the REGION location changes to 2000.
The following table compares the initial and mass-edited values:
| Location | Initial Hours | Mass-Edited Hours (By Value Distributed) |
|---|---|---|
| REGION | 1000 | 2000 |
| DISTRICT 1 | 400 | 600 |
| DISTRICT 2 | 600 | 1400 |
| STORE 1.1 - MALL LOCATION | 100 | 300 |
| STORE 1.2 - BIG-BOX LOCATION | 300 | 300 |
| STORE 2.1 - MALL LOCATION | 400 | 1200 |
| STORE 2.2 - BIG-BOX LOCATION | 200 | 200 |
The following diagram displays the initial and mass-edited values in the context of the hierarchy:
