Example of regenerating workload
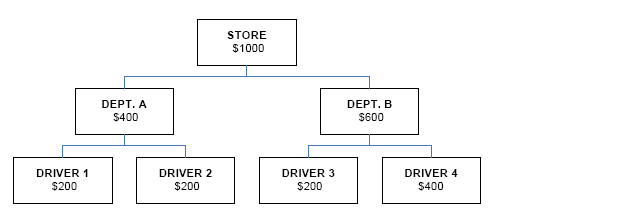
For example, suppose that the driver forecast is $1000 in sales for a store with two departments.
- Suppose that the sales forecast for department A is $400, which is based on the sales forecast of $200 from driver 1 and $200 from driver 2.
- Suppose that the forecast for department B is $600, which is based on the forecast of $200 from driver 3 and $400 from driver 4.
Only the store and department values are displayed on the Worksheet: The individual driver values are not displayed there.
The following diagram displays the forecasted value for the drivers, departments, and the aggregate forecasted value for the store:

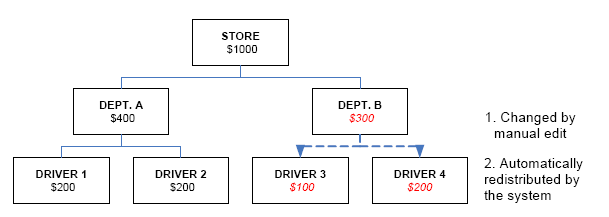
Suppose that you edit the sales forecast for department B and change its forecast to $300. This changes the forecast sales for the entire store to $700, which is the sum of department A and department B. The application performs this calculation whenever you recalculate, save, or lock the Worksheet.
However, the values of the drivers do not automatically change accordingly: Recall that the department forecast is the sum of its driver forecasts. Now that the forecast for department B is $300, the sum of the driver 3 and driver 4 forecasts cannot still be $600. Therefore, the driver forecasts must change accordingly.
When the application recalculates workload, it distributes the new value for the department to the constituent drivers. Therefore, the new value for forecasted sales for driver 3 is $100, and the new value for forecasted sales for driver 4 is $200.

Remember that these drivers are used to calculate staffing requirements, which produces workload. Now that the drivers have changed as a result of changing the forecasted sales for a department, the required workload must change too. The application uses the new driver values to regenerate the workload values.