Employee Overtime Cost Report
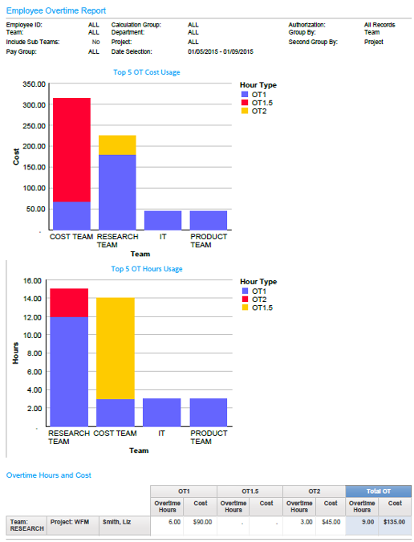
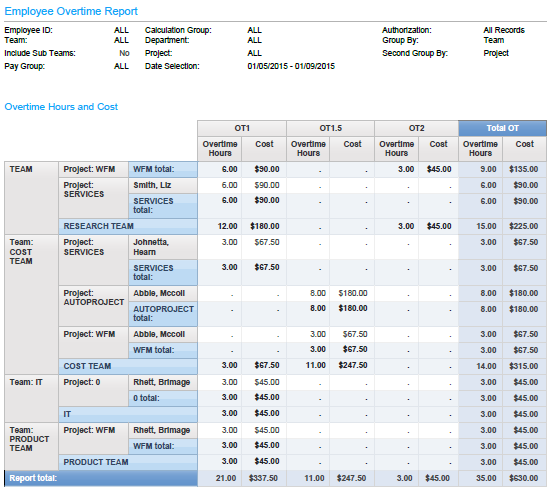
The Employee Overtime Cost report shows the number of hours an employee worked for each overtime hour type (OT1, OT2, OT3, and so on) and its associated cost on each date within the selected interval. Two bar graphs are displayed: the first graph lists the five teams with the highest OT cost, the second graph lists the five teams with the highest OT hours. A table is located beneath the graphs for all teams and is organized according to the values selected in the Group By and Second Group By fields.
Note: The legend displayed on the report is for Hour Type.
Example output:

Example output page 2:
