Specifying scales for the chart
You can specify a scale for the axis representing data which is dependent on data displayed on the other axis (usually the X axis). You cannot specify a scale for the first element in a coordinate pair (usually referred to as the X Axis).
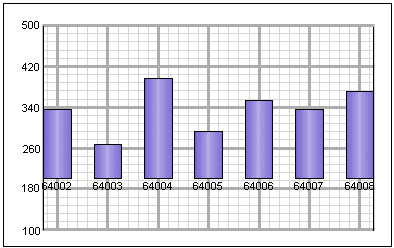
In this example, the minimum scale is 100, the maximum scale is 500 and the baseline entered in the Cross at field is 200:
On the X Axis (or Y Axis) tab: