Trend Rules
Trend rules are guidelines used to interpret data points on a control chart to identify non-random patterns that indicate process instability. These rules help identify and monitor trends, shifts, or cycles in the data, signalling potential issues in manufacturing or service operations. These are the available trend rules:
- Run of points increasing
- Run of points decreasing
- Run of points below the central line
- Run of points above the central line
- Points below the Lower Control Limit (LCL)
- Points above the Upper Control Limit (UCL)
- 4 out of 5 Points Outside 1 Sigma Zone
- 2 out of 3 Points Outside 2 Sigma Zone
Run of Points Increasing
A Run of Points Increasing occurs when N consecutive points increase consistently in value. This indicates a potential upward trend in the process. The default value for N is seven.
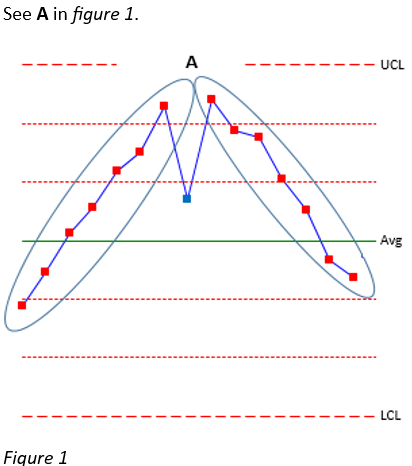
Run of Points Decreasing
A Run of Points Decreasing occurs when N consecutive points decrease consistently in value. This indicates a potential downward trend. The default value for N is seven.
See A in figure 1.
Run of Points Below the Central Line
When N consecutive points fall below the central line (mean), this indicates a reduction in the process average. The default value for N is seven.
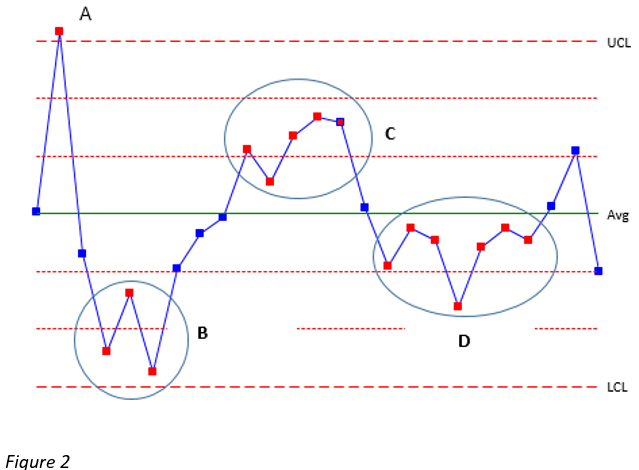
See D in figure 2.
Run of Points Above the Central Line
When N consecutive points fall above the central line (mean), this indicates an increase in the process average. The default value for N is seven.
Points Below the Lower Control Limit (LCL)
One or more points below the Lower Control Limit (LCL) indicate a sudden or unusual process change.
See A in figure 2.
Points Above the Upper Control Limit (UCL)
One or more points above the Upper Control Limit (UCL) indicate a shift or anomaly in the process change.
See A in figure 2.
4 out of 5 points outside 1 sigma zone
This rule triggers when 4 (Trend Range) out of 5 (Trend Extent) consecutive points fall in Zone B or beyond (between 1σ and 2σ from the mean, or further). This indicates increasing process variation or movement toward instability. Default values:
- Trend Range = 4
- Trend Extent = 5
See C in figure 2.
2 out of 3 points outside 2 sigma zone
This rule triggers when 2 (Trend Range) out of 3 (Trend Extent) consecutive points fall in Zone A or beyond (beyond 2σ from the mean). This indicates the process is approaching control limits and require attention. Default values:
- Trend Range = 2
- Trend Extent = 3
See B in figure 2.