Auto THETA
The Theta method is a basic, robust forecasting technique. Use the Theta method for monthly and quarterly business data with trends.
The Theta method won the M3 forecasting competition (Makridakis and Hibon, 2000) by achieving the lowest error across 3,003 business time series. Despite its simplicity, it's essentially SES with drift and a theta transformation. It outperformed far more complex methods, making it an excellent benchmark for business forecasting.
Key features
- Basic and robust: Requires minimal parameters and is hard to overfit
- Proven performance: Recognized as a winner in the M3 competition
- Trend handling: Excellent for data with linear trends
- Seasonal support: Supports optional seasonal decomposition
- Automatic fallback: Handles edge cases gracefully
Algorithm
The Theta method works by:
- Fitting a linear regression to capture the drift or trend in the data.
- Applying a theta transformation to the data.
- Fitting Simple Exponential Smoothing (SES) to the transformed series.
- Combining the SES forecast with the linear drift.
Mathematical formulation
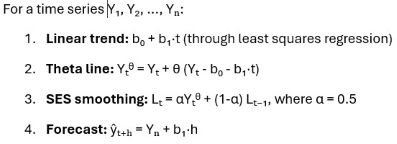
With seasonality:
Theta uses seasonal decomposition when a seasonal period is specified:
- Calculate seasonal indices (average for each season).
- Deseasonalize the data (remove the seasonal pattern).
- Apply standard Theta to the deseasonalized data.
- Reseasonalize forecasts (add the seasonal pattern back).

Parameters
This table shows the parameters that define how the Theta method is configured:
| Parameter | Description |
|---|---|
| Theta Parameter |
|
| Seasonal Period |
Note: Requires at least 2 × seasonal period data points, such
as 24 months for monthly seasonality.
|
| Seasonal Type |
|
Fallback behavior
The table shows how the method automatically falls back to basic models when required:
| Condition | Fallback | Description |
|---|---|---|
| n < 3 | Naive | Uses last value |
| Variance ≈ 0 | Mean | Uses average |
| Fit fails | Linear Trend | Basic regression |
When to use Theta
It is best suited for:
- Monthly or quarterly business data.
- Data with linear trends.
- Medium-term forecasts (1–12 periods).
- Situations where simplicity and robustness are priorities.
- Benchmarking against complex methods.
It is not recommended for:
- Multiple seasonality (use BATS or Prophet instead).
- Intermittent demand (use TSB or Croston instead).
- Complex non-linear trends (use ETS or ARIMA instead).
- Very short series (less than 10 data points).
Comparison with other methods
This table shows how the Theta method compares with other forecasting methods:
| Method | Complexity | Trend | Seasonality | Best for |
|---|---|---|---|---|
|
Theta |
Low |
Linear |
Single |
Business data, benchmarks |
|
ETS |
Medium |
Any |
Single |
General purpose |
|
ARIMA |
High |
Any |
Single |
Complex patterns |
|
BATS |
High |
Any |
Multiple (ours Single) |
Complex seasonality |
|
Prophet |
Medium |
Non-linear |
Multiple (ours Single) |
Holidays with Presets |
|
TSB |
Low |
None |
None |
Intermittent demand |
Performance tips
These tips help improve the performance and reliability of the Theta method:
- Use theta = 2 as default: It is the M3 competition winner.
- Specify seasonal period: Set this if your data has seasonality (for example, 12 for monthly data).
- Check warnings: Always inspect the LastWarning property.
- Compare with ETS: Theta often matches or outperforms ETS for trending data.
- Ensemble: Combine with other methods for best results.
Technical details
These technical details outline the data requirements, performance characteristics, and key limitations of the Theta method:
- Minimum data requirements
- No seasonality requires a minimum of 3 data points.
- With seasonality requires at least 2 × seasonal period data points.
- Computational complexity
- Time complexity is O(n), making it very fast.
- Space complexity is O(n), requiring minimal memory.
- Limitations
- It assumes a linear trend and does not support exponential growth.
- It supports only a single seasonality.
- It is univariate and uses only the historical values of the series.