Starting the debug server

Use this procedure to start the debug server. Debug is always performed on the file that is deployed on the Server. The subsystem is started with the default Company (CONO) and Division (DIVI) values that are specified for the used M3 BE user/system configuration in M3 Business Engine (BE).

Note: MAK will automatically detect if there is an existing debug subsystem running. Clicking Retry will attempt to close the detected existing connection while clicking Cancel will disregard the option to start a new debug system.
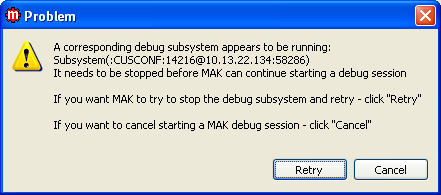
Note: Ensure that you have stopped an existing debug subsystem process before you can start a new session.
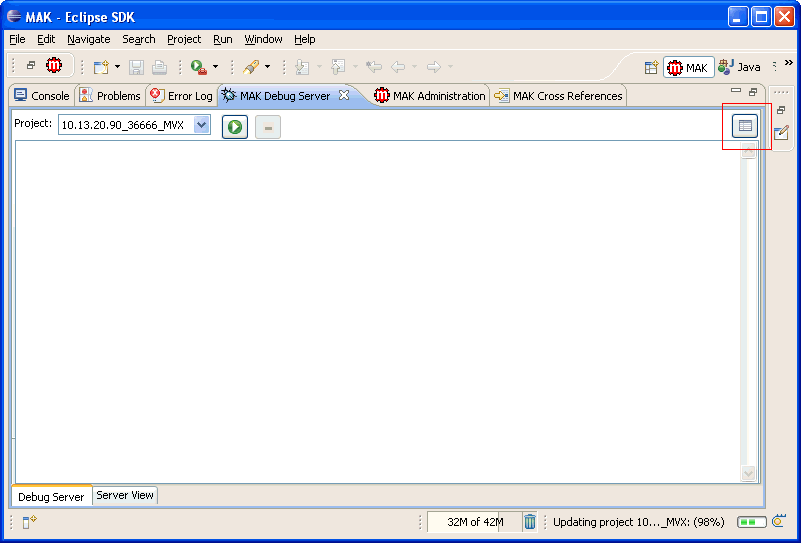
  1. In the MAK Debug Server tab, click the start button. These actions are performed:
    • Activate the M3 user as debug user.

    • Start a debug subsystem on M3 Application Server.

    • Start the local debug server on the MAK server.

    • Start a connection between the debug server and the debug subsystem.

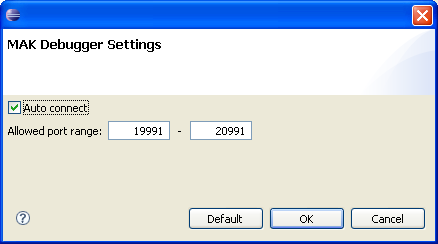
  2. Click the Debugger Properties icon (see red box) to modify the MAK Debugger Settings:
    • By default a free port number is assigned while starting the debug server. In the Allowed port range field, ensure that you fill in both maximum and minimum port values or leave them both blank. The port range must be within the range of values from 1024 to 65535. You can click the Default button if you want to reset the port values to their default values.

    • If you do not select Auto-connect debug, only the local debug server is started. The activation of the debug user, the start of the debug subsystem and the start of the connection must be done manually.

  3. Add breakpoints in a program entity.
  4. Start the program to debug in Explorer or Net Extension. If a breakpoint is active in the program that is running, the execution stops on the selected line in the Debug perspective.

    The debug section is now ready for stepping and viewing variables.

  5. To make the debug easier, open these views in the Debug perspective:
    • Debug – shows the threads that execute

    • Editor with code – displays the source file

    • Variables – shows all variables

    • Breakpoints – lists all breakpoints that is set

    • Expression – lists all variables that are watched

    • Display – used to execute expressions

    If these views are not opened, go to Window > Show View and select the view that you want to display.

    Note: Ensure that the Program being debugged is synchronized with the copy in the M3 Business Engine (BE) or Sandbox. You can do this using the Deploy task. If you need to debug all changes that you made to the program, you have to deploy it to the Sandbox first to test and then deploy it to the BE when it is ready.