Using tooltips in a chart
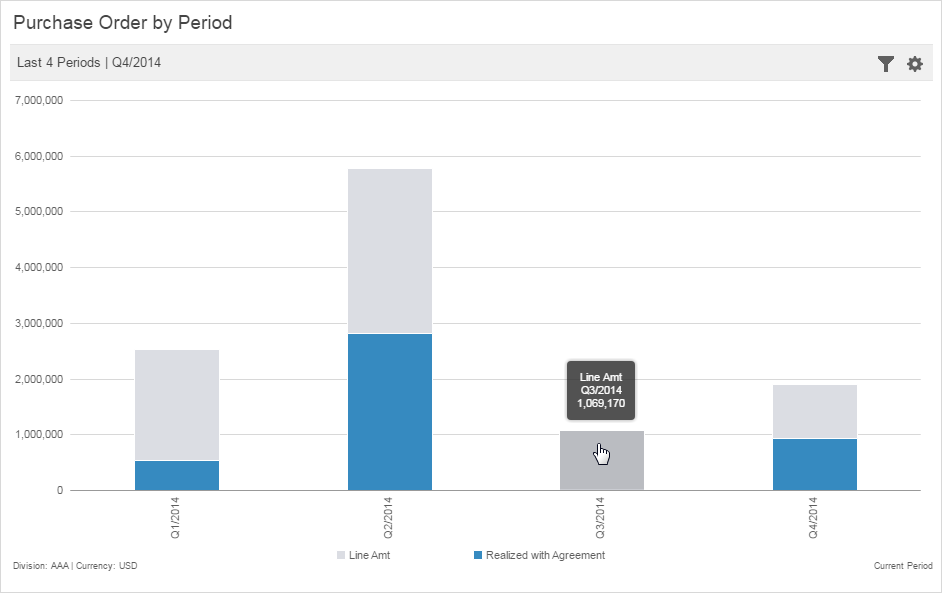
The tooltip shows additional information about a category. Place your cursor over a category to display its totals. The color of a chart element, for example, a bar in a bar chart, also changes when you hover over it.

The tooltip shows additional information about a category. Place your cursor over a category to display its totals. The color of a chart element, for example, a bar in a bar chart, also changes when you hover over it.
