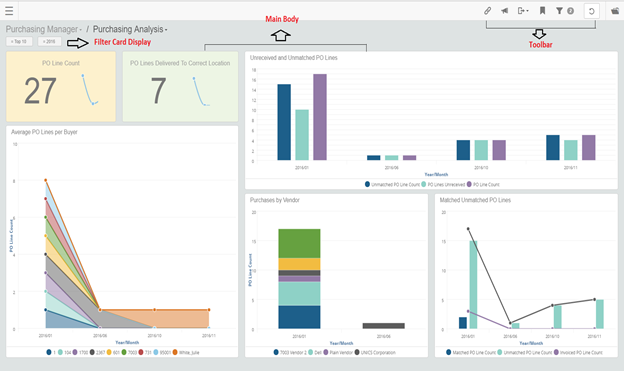
Dashboard features
Infor Birst has fully responsive and integrated HTML5 dashboards and visual discovery interfaces. Users can explore data with features such as drag-and-drop and double-click, auto-complete Search, guided visualizations, and visual filtering.
Filters for specific attributes are built into the reports. Click the charts and 'lasso' a set of data to focus on, or click the Chart Legend to remove values from the display. Results are cascaded across the dashboard.
