User monitoring report details
The data captured by the user monitoring feature can be viewed in a report format. The available data includes:
-
User IDs
-
Names of application modules users accessed
-
Host name and IP addresses from which users accessed
-
Session IDs
You can create a report for which you specify a start and end date and time range. The user monitoring feature retrieves records and formats them in a CSV output file. (The CSV file is compressed on your system in .zip format.)
The data in the column includes the following items:
-
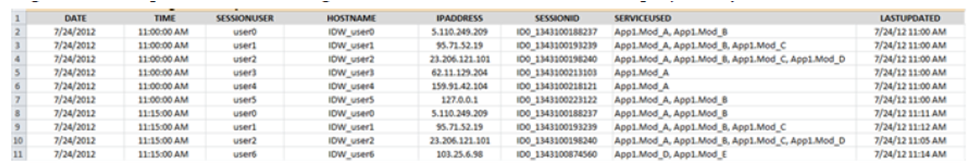
The output example above shows monitoring results for four users (user0, user1, user2, user3) starting at 11:00 AM. The report has entries for each user starting at 11:00 AM and then again at 11:15. (By default, the user monitoring tool writes a record for each user every fifteen minutes.) Notice that in the example, there are more than eight entries, which would represent four users during two intervals. This is because some of the users have accessed more than one module, as you can see from the column labeled SERVICEUSED.
The table below shows some details about the data in each column.
Field Data type Description Date and Time Strings The date when the peak usage was captured.
For example, if you had specified the report to pull peak usage records beginning at 11:00 AM on 24 July and configured 15-minute intervals, the first set of entries would be for 24 July at 11:00 AM, the next entries would be fore 24 July at 11:15, the third set would be for 11:30, and so on.
SessionUser String The user ID of the user running the application. HostName String Host name of the machine used by the user.
Note: If HostName cannot be determined, this field defaults to IP Address.IPAddress String The IP address of the machine used by the user. Depending on the network setup, the IP address displayed may be that of a proxy or an external load balancer (ELB). SessionID String Unique identifier of the user session that is being monitored. AccessedComponent / ServicesUsed / Transactions String Comma-separated list of values in the format:
Application1.Module1, Application2.Module2LastUpdated Timestamp The date and time of the last transaction recorded for the user session during the monitoring period. OTHERCOMPONENTS String This field is populated with the service name that is associated with the specific HTTP request that was captured by User Monitoring sensors. Possible values for this field include: - SSOP, which is the default value if requesting service information is not available on the HTTP request.
- IOS, which is used when LSF forms are accessed. For example, HR/Payroll.
- PRODLINE.LPA.LPA, which is used for for Infor Process Automation workflows connecting to LSF.
- LSADMIN, which is used when Lawson Security Administrator (LSA) is accessed.