View peak usage history
Users can also view peak usage history in the following ways:
-
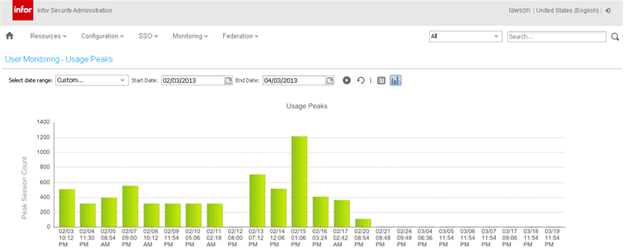
Usage Peaks: Shows the largest number of concurrent users for the specified timeframe.
-
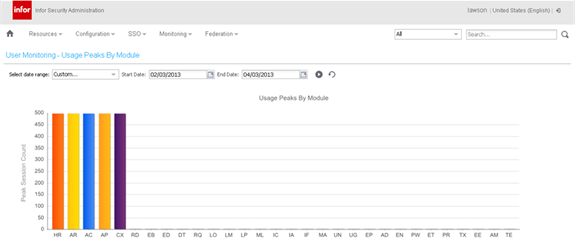
Usage Peaks by Module: Shows the largest number of concurrent users of a specific application for the specified timeframe.
To view peak usage, from the dashboard (which is accessible from the top of the page) select Monitoring and then select Usage Peaks or Usage Peaks by Module. You can change the data view by selecting a date range from the toolbar.The table that follows shows the available date ranges and associated time scales.
| Data view... | Time scale shows... |
|---|---|
| Today | Hours |
| Yesterday | Hours |
| Previous | Three highest peaks each day |
| This week | Three highest peaks each day |
| Months | Four highest peaks each day |
| Custom range | Varies, depending on range selected. |