Debug (Trace) Mode
If you or a user receives unexpected results from a call or transaction in Lawson Portal, you can run debug (or trace) mode to try to isolate the problem.
You can append the debug command (?debug=true) to any Lawson Portal URL to open a window that lists all calls that have been made to Lawson Portal. The debug URL format is:
http://YourServer.YourDomain.com/PersistData/lawson/MyWorkspace/?debug=true
A window showing the commands that have been recently processed by Lawson Portal appears. The information about the calls should help you isolate where the unexpected results came from.
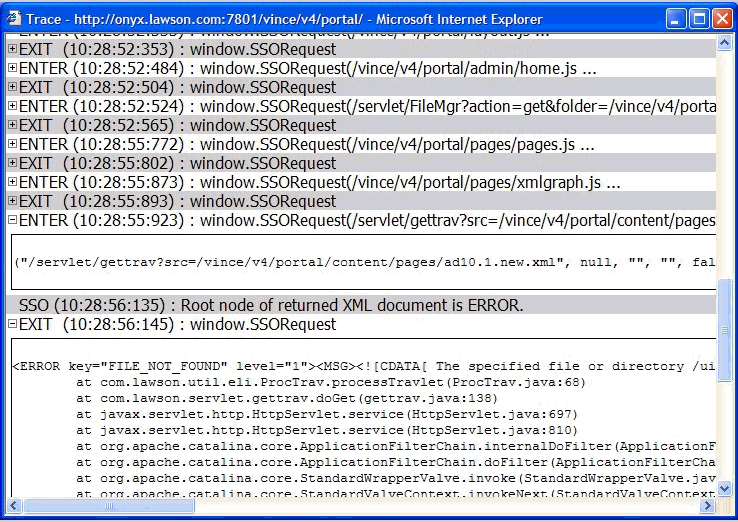
The screen shot (above) of the trace window is an example of how a problem could be debugged. In this example the user tried to navigate to Lawson Portal but received a message box saying the "specified file or directory ... was not found." (The plus image indicates you can click to expand the trace entry to view more information.)
The trace window shows the server call made by Lawson Portal to retrieve the page (ENTER - window.SSORequest with the servlet call and its parameters). This is followed by the SSO component reporting it detected an ERROR response. The SSO report is followed by XML data that was returned to the SSORequest method (EXIT - window.SSORequest with the message displayed by Lawson Portal and the details of the servlet error condition). This details exactly which file was requested but not found and suggests that either the link for the page is no longer valid or that the page XML file was deleted.