Location Section
This section provides a map view of the engineers and activities (assigned/unassigned/planned), which helps in easily identifying the location of the engineer and the activity.
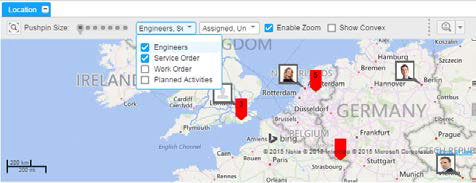
You can filter the data to be displayed using the Items To Show list option. The image displays the filter applied on the engineer and the service order. Similarly, you can filter the assigned activities, unassigned activities, and the engineer’s locations that must be displayed on the map.
Icons
| Icon | Description |
|---|---|

|
Activity pushpin: Represents the assigned and unassigned service activities. User can hover over the pushpin to view the tooltip. |

|
Work Order Pushpin: Represents the assigned and unassigned work order activities. User can hover over the pushpin to view the tooltip. |

|
Engineer Pushpin: Represents the location of the engineer. |

|
Planned Activity Pushpin: Represents the planned activities. User can hover over the pushpin to view the tooltip. |
Location Section – Other Features
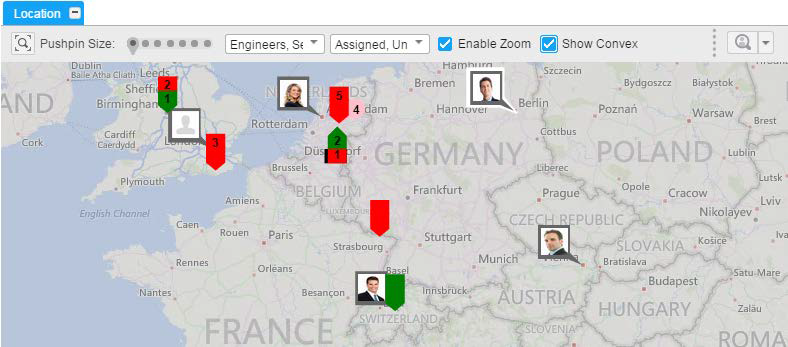
The Map/Location section displays the pushpins to represent the engineer, assigned service activity/work order, unassigned service activity/work order, and planned activity.
Pushpin Selections and Zoom
- To remove all selections, click on a blank area of the map.
- Press Shift + Click to select multiple activities.
- When you zoom to a particular location, only the activities available for the location are displayed.
- To select a region or group of activities, you can also press CTRL and drag the pointer to create a box over the required region or activity.
- To zoom to a particular region or activity’s location, press SHIFT and drag the pointer to create a box over the required area.
- Activities are displayed as pushpins on the map. You can define the size of the pushpins.
- For a group of activities with the same location address or the same area or when you zoom out of an area or a location, a single pushpin represents the region. The pushpin displays the number of activities. For example, for Germany, a group of 7 unassigned and 9 assigned activities are displayed. The first part of the pushpin displays the unassigned activities and the second part displays the assigned activities. You can define the colors for the pushpin in the User Settings > Map Pushpin section on the Colors tab.
- Use the Enable Zoom option to zoom in on the activity address.When this option is cleared, the map remains at the level already selected by you and you cannot zoom in further.
- Use the Zoom to Fit option to zoom in and view all the selected activities and engineers.
- Use the Show Convex Hull option to indicate the current work area of the engineer.
Find Closest Engineer
Use this option to locate the engineer closest to the selected activities. This option is used to calculate the distance and time that the engineer takes to travel to the location address of the activity.
To enable the Closest Engineer option:
- Multiple engineers and a single activity must be selected. Use the SHIFT + Click option or press CTRL and drag to create a box over the activities and engineers, and view the required details.
-
The estimated time and distance is populated and an Assign option is displayed. To assign the engineer, select the Assign option. The activity is displayed on the Gantt chart. The route to each of the selected activities is displayed in Blue.
Note: Work order selection is not supported by the Find the closest engineer functionality
Show Convex Hull
Using this functionality, you can view the activities of the engineer, spread across a geographical area.
To view the Convex Hull:
- Select the Engineer(s) (in the Gantt section or on the Map).
- On the map tool bar, select the Convex Hull check box. The highlighted geographical area displays the location of the activities for the selected engineer(s) in the Gantt’s time range.
- When you move the Gantt scale, the convex hull realigns the current activities on the Gantt (for each of the current scale) chart.