Contract line graph
The utilization of the contract quantity is compared with the duration of the contract line and is displayed in a graph using the Sales Contracts (tdsls8330m000) or Purchase Contracts (tdpur8330m000) sessions.
When you select a contract line in these sessions, a graph is displayed in the Usage versus Duration group.
Example
| Contract line effective date | 1/1/2015 |
| Contract line expiry date | 31/12/2015 |
| Current date | 1/5/2015 |
| Agreed quantity | 300 |
| Delivered quantity | 500 |
The graph shows these columns:
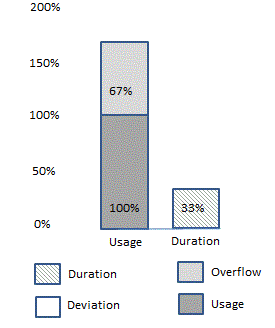
Duration
The contract line is active and only 33% (4 months) of this contract line has passed. Duration = (current date - effective date (120 days) / expiry date – effective date (365 days) * 100 = 33% (rounded).Usage
With an agreed quantity of 300 and a delivered quantity of 500, the agreed quantity is delivered. So, the usage is (100*300/300) = 100%.Overflow
With an agreed quantity of 300 and a delivered quantity of 500, an additional quantity of 200 is delivered. So, the overflow is (100*200/300) = 67%.Deviation
Because of the overflow, the deviation is zero. However, if only a quantity of 50 is delivered (usage of (100*50/300) = 17%), the deviation is 16%. Consequently, the delivery of the agreed quantity would be behind schedule.