To create Xbar and S control charts
Control charts are used to regularly monitor and control a process.
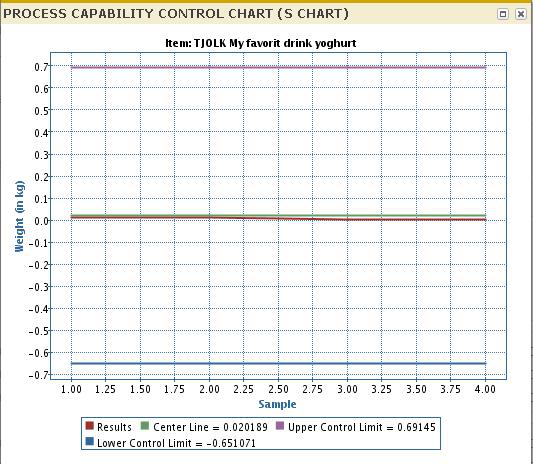
The lower plotting area of the chart is the standard deviation (S) of the measured values for each sample. The S chart is created first to ensure the statistical control of the sample variability.
To generate an Xbar and S Control Charts, complete the following steps:
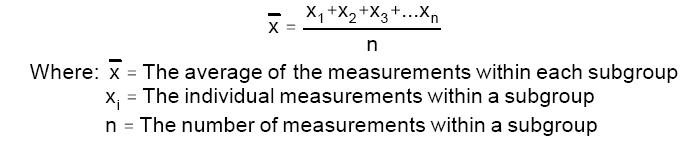
Consider each sample as a subgroup. Calculate the average of measured value for each sub-group.
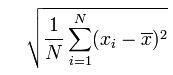
Calculate the standard deviation S for each subgroup.
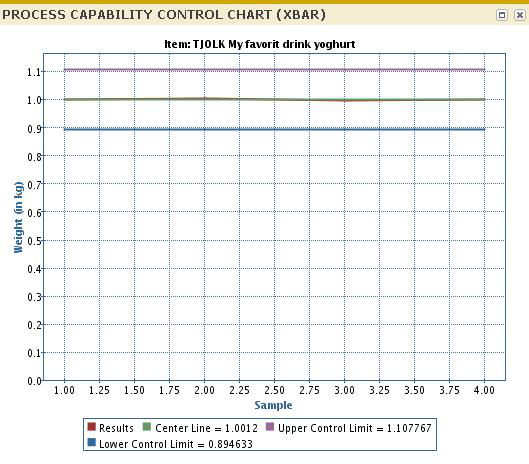
Calculate the mean of all the values. All values must be cumulated and divided by the total number of values. The calculated mean becomes the center line for the upper plotting area of the chart.
Calculate the average of sub-group ranges. The average of all sub-groups becomes the centerline for the lower plotting area of the chart.
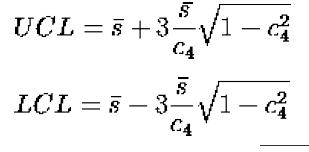
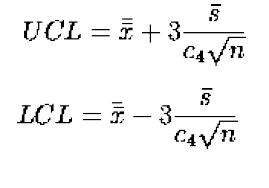
Calculate UCL & LCL for averages of subgroups. Use the following formulae to calculate the limits, these limits are plotted in the upper plotting area:
The range limits for the standard deviations are calculated using the following formulae. These limits are plotted in the lower plotting area.