To create process capability control charts
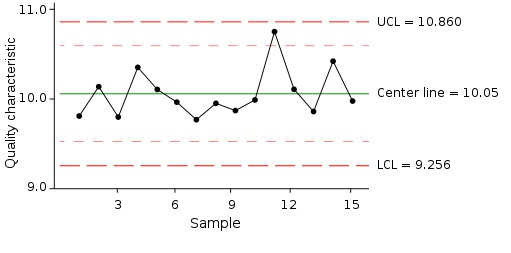
Process control capability charts are used to ascertain if the variation in process related characteristic is under statistical control, by creating a chart which contains both a calculated and target based upper and lower control levels.
To plot this chart you must select the combination of item or item/supplier, inspection order source, aspect/characteristic as well as the relevant time period. This chart is based only on actual inspection results.
The upper plotting area is used to monitor the process mean and the lower plotting area is used to monitor the process deviation from the mean.
The three most commonly used chart types are:
- To create Xbar and R control charts
- To create Xbar and S control charts
- To create Xm and R control charts