To create parts per million charts
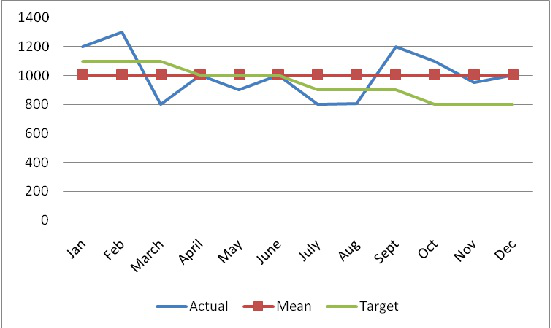
This chart is used to compare the actual Parts per Million (PPM) quality performance of an item against a target and mean measurement (for a month/year). The chart is drawn from the actual inspection results for a user defined period.
Example
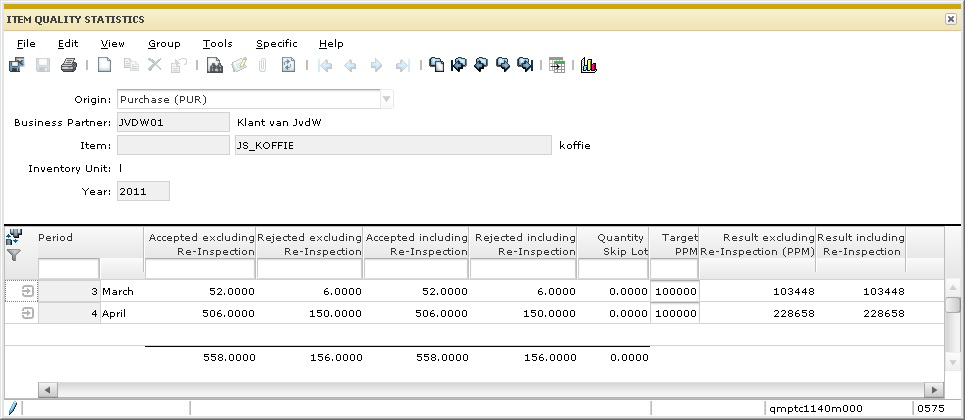
The part per million charts is created based on the data in the Item Quality Statistics (qmptc1140m000) session. Example:
The chart is plotted, based on the following rules:
- PPM values are determined for every order origin, item or item/supplier, year and period.
- Assume that every unit of an inspected item is an opportunity.
- Determine the total number of units inspected in the period, that is, the total opportunities per period.
- Determine the total numbers of units rejected in the period, that is, the total defect per period.
- Defects per Opportunity represents the number of defects divided by the number of opportunities in the period. Defects per Opportunity per Period = Total Defects per period Total Opportunities per period.
- Defects per Million Opportunities represents the defects per period times a million. Defects per million Opportunities per month = Defects per Opportunity per month x 1000000
- Defects per Million per Year is similarly calculated using the total number of opportunities and the total number of defects in the year.
- The calculated data of Defects per Million Opportunities per period is displayed. Each period is represented by an individual point on the chart.
- The Defects per Million Opportunities per year can be plotted as a calculated mean across all periods in the year or for each quarter.
How it works in LN
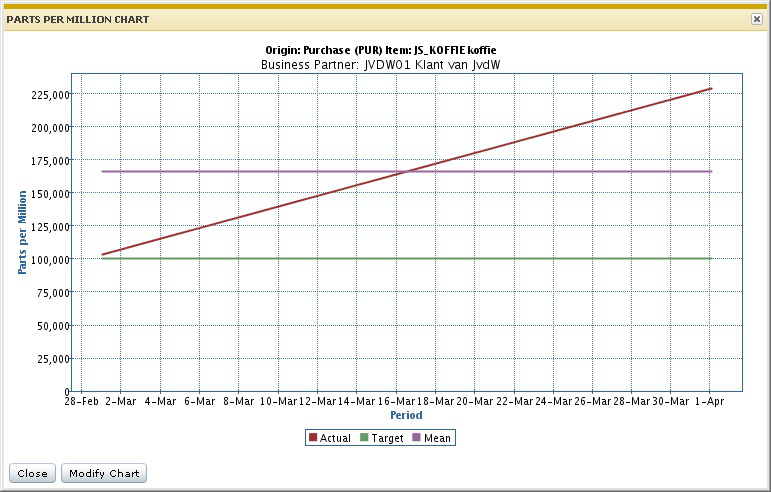
You can access the PPM chart from the Item Quality Statistics (qmptc1140m000) session. The chart is created for the display fields in the session, for all the periods of the selected year. When multiple periods are selected, the range is extended based on the selection.
When the chart is initially started, the defaults are saved in the Parts Per Million Chart (qmptc1740m000) session. Click Modify Chart to change the values.
The following are the options to modify the PPM chart:
Include Skip Lot Accepts:
This flag determines if accepted batches for skipped order inspections must be included in the data used to generate the chart.
Re-Inspection:
Use the Excluding Re-Inspection and Including Re-Inspection options to determine the data used to generate the chart. The following example describes how data is plotted in the chart for the selected option.
Example
The following orders are defined for a period:
| Unit | Sample | Characteristic 1 | Characteristic 2 | Characteristic 3 | Result |
| 1 | 1 unit | Pass | Fail | Fail | 1 sample failed |
| 2 | 1 unit | Pass | Pass | Pass | 1 sample passed |
| 3 | 1 unit | Fail | Fail | Fail | 1 sample failed |
| 4-5000 | 4996 units | Pass | Pass | Pass | 4996 samples passed |
The result is 2 failures out of a sample of 5000 or 2/5000 *1,000,000 or 400 ppm.
| Order Inspection | Order Quantity | Sample Quantity | Accepted / Rejected | Re-inspection Order |
| 1 | 100 | 100 | Accepted | |
| 2 | 200 | 200 | Rejected | 3 |
| 3 | 200 | 200 | Rejected | |
| 4 | 200 | 200 | Rejected | |
| 5 | 200 | 200 | Accepted | |
| 6 | 200 | 200 | Rejected | 7 |
| 7 | 200 | 200 | Rejected | 8 |
| 8 | 200 | 200 | Accepted |
The cumulative results are:
- Quantity Accepted excluding Re-Inspection: 300 (order 1 and 5).
- Quantity Rejected excluding Re-Inspection: 600 (order 2, 4 and 6).
- Quantity Accepted including Re-Inspection: 500 (order 1, 5 and 8).
- Quantity Rejected including Re-Inspection: 400 (order 3 and 4).
The results are displayed in the Item Quality Statistics (qmptc1140m000) session:
| Accepted excluding re-inspection | Rejected excluding re-inspection | Accepted including re-inspection | Rejected including re-inspection | Quantity skipped |
| 300 | 600 | 500 | 400 | 0 |
If you select the Exclude Re-Inspection option, the data on the chart is plotted as:
- Accepted - 300
- Rejected - 600
If you select to Include Re-Inspection option, the data on the chart is plotted as:
- Accepted - 500
- Rejected - 400