To create Xm and R control charts
Control charts are used to regularly monitor and control a process.
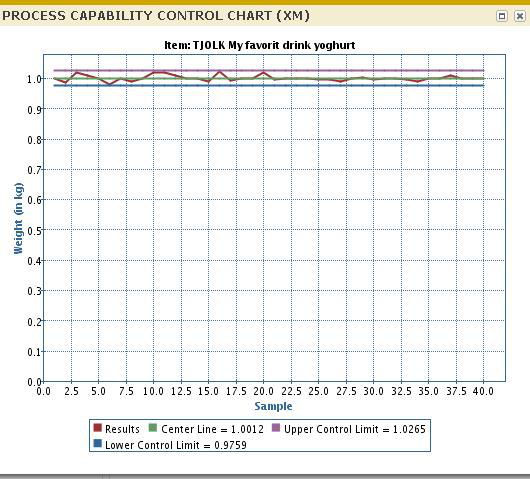
This combination of charts is used where the characteristic of interest sample size is more dynamic and varied. The XmR chart analyzes every sample and is a combination of two charts; the individual X chart is displayed in the upper part of the screen and the moving Range chart is displayed in the lower part of the screen.
The upper plotting area of the chart displays the measured values of all instances within a sample with the x-axis representing time dimension. The lower plotting area of the chart displays the moving spread/range (R) of the measured values compared to the preceding measurement.
To generate the chart
Each sample measured value is plotted as individual X points. Considering Xi represents the measured value of an individual sample, individual Xi values are plotted on the x-axis.
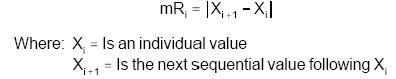
Calculate the Moving Range values between two successive Xi data points using the following formula. The Moving Range mRi is plotted on x-axis. The brackets (| |) represent the absolute value of the number inside the brackets.
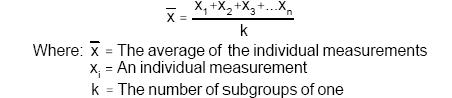
Calculate the overall average of the individual Xi data points. The average of Individual X values becomes the centerline for the upper plot.
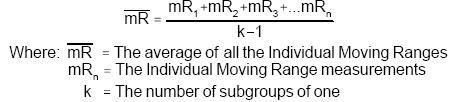
Calculate the average of the moving ranges. The total average of all moving ranges becomes the centerline for the lower plotting area.
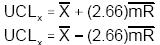
Calculate the upper and lower control limits for the individual X values for the upper plotting area. Use the following formula for the computation.
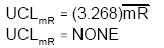
Calculate the upper control limit for the moving ranges for the lower plotting area. There is no lower control limit for the moving Ranges. Use the following formula.