To create Xbar and R control charts
Control charts are used to regularly monitor and control a process.
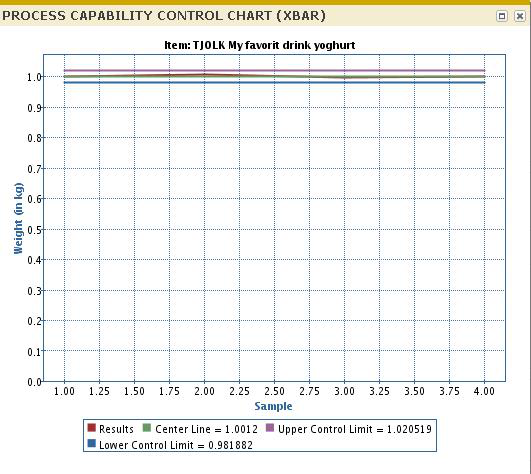
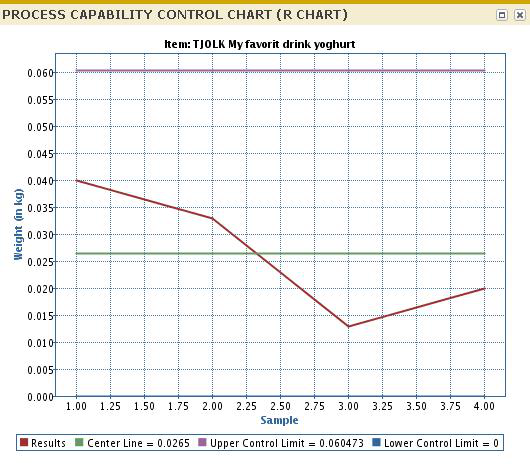
This combination of charts is used where the characteristic of interest sample size is stable, fixed and between 2 to 15 units. The upper plotting area of the chart is the average (Xbar) measured value per sample and the x-axis represents time. The lower plotting area of the chart displays the range (R) of measured values for each sample. The R chart that is created first is reviewed to ensure the statistical control of the sample variability. The Xbar chart is displayed in the upper part of the screen and the R chart is displayed in the lower part of the screen.
To generate an Xbar and R Control Charts, complete the following steps:
For inspection orders where the item characteristic is a stable sample size, you must consider each individual sample as a sub-group.
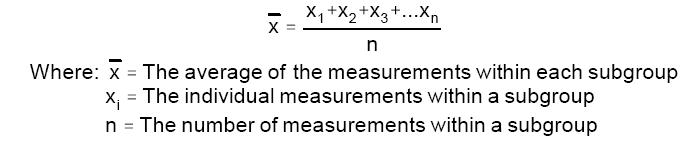
Calculate the average of measured value for each sub-group.
Calculate the range of measured value for each sub-group:
Range(sub-group) = Largest Measured Value (sub-group) - Smallest Measured Value
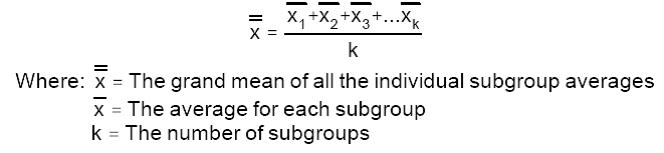
(sub-group)Calculate the mean of each subgroup's average. The mean of each subgroup's average is the centerline for the upper plotting area of the chart.
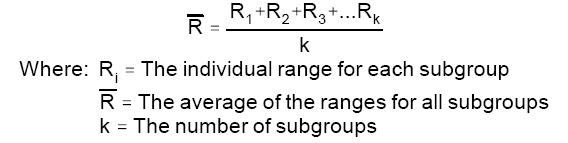
Calculate the average of Ranges sub-group. The average of all sub-groups is the centerline for the lower plotting area of the chart.
Calculate UCL and LCL for averages of subgroups. Use the following formula to calculate the limits plotted in the upper plotting area:
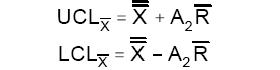
The above limits are calculated based on A2 value (from Factors for Control Limits) for the corresponding sub-group (sample) size N. In case the sample size is not constant, to determine the average sample size, use this as the input to determine value of A2. When the (average) sample size exceeds 15 units, the control limits are not calculated and a warning is displayed on the charts.
The range limits are calculated using D3 & D4 values for corresponding sub-group size N. These limits are plotted in the upper plotting area. Calculate the control limits for the Ranges, using this formula: