Breakpoints view
In this view, you can perform these actions:
- Double-click a breakpoint, or use the command, to display its location in the Script Editor.
- Enable or disable breakpoints.
- View or modify the properties of a breakpoint.
- Delete breakpoints.
For information on adding breakpoints, see Using breakpoints.
Toolbar
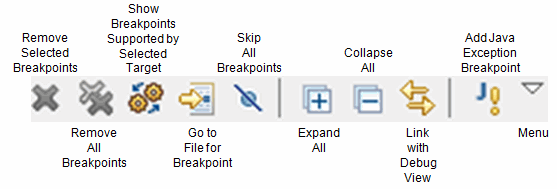
The toolbar of the Breakpoints view contains these buttons:

| Show Breakpoints Supported by Selected Target |
When you use multiple programming languages within the Eclipse workbench such as Infor 4GL and Java, you can define different types of breakpoints per language. If this option is toggled on, only breakpoints applicable to the selected debug target are displayed, such as the following:
|
| Go to File for Breakpoint | Displays the source code and the line associated with the selected breakpoint in the Editor area. Double-clicking a breakpoint has the same effect. |
| Skip All Breakpoints | Disables all breakpoints. |
| Link with Debug View | When this option is toggled on, the breakpoints hit by the debugger are automatically highlighted in the Breakpoints view. |
| Add Java Exception Breakpoint | Starts the Add Java Exception Breakpoint dialog box. See the online help of the dialog box. |
Shortcut menu
Right-click on any breakpoint in the view to open a shortcut menu. The menu contains these commands:
- Ctrl + A
- Ctrl + Insert
- Shift+Insert
Use the shortcut menu to enable and disable breakpoints. Alternatively, select or clear the check boxes displayed in front of the breakpoints.
When you run the command, a dialog box is started where you can view and modify the properties of the selected breakpoint. In this dialog box you can, for example, enable or disable a breakpoint. See these sections:
Icons and decorators
Icons
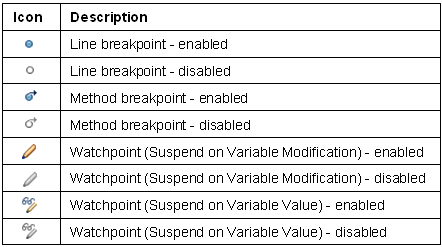
These icons are displayed in the Breakpoints view:

Decorators
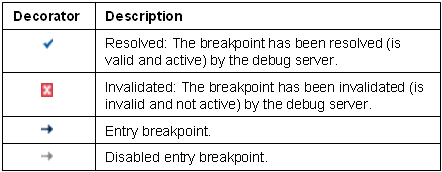
The following decorators are used to indicate whether a breakpoint is installed or invalidated. They are displayed in the bottom left corner of the breakpoint icon.
