Variables view
The Variables view is part of the Debug perspective.
The Variables view displays a list of variables that exists in the scope of the selected Stack frame. The values of primitive variables are displayed. To examine a complex variable, expand the variable to show its members. XML nodes are displayed in an XML tree, which you can collapse and expand.
The view is usually empty. However, it is automatically filled when a session in debug mode is suspended, and a stack frame is selected in the Debug view.
This figure shows an example:

The left part of the screenshot shows the Debug view with the selected stack frame. The right part shows the Variables view with the stack frame's variables. In the screenshot, the Variables view consists of an overview pane (top) and a details pane (bottom).
The details pane shows this information:
- The value of primitive variables.
- The hexadecimal value of variables of type string.
- The XML structure of variables of type XML.
You can determine the amount of information displayed in the Variables view. For example, you can show / hide the following:
- Data type information.
- The details pane.
See the description of the toolbar and shortcut menu commands.
Toolbar
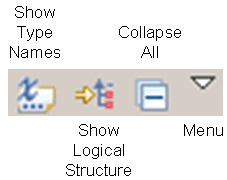
The toolbar of the Variables view contains the following buttons:

| Show Type Names | You can toggle this option to show or hide data type names. The data type names are displayed in front of the variable names. |
| Show Logical Structure | Displays certain complex data structures in a more compact and meaningful form. For example, the elements of a list are displayed as an ordered collection. |
| Collapse All | Collapses all expanded variables. |
| Menu | Contains these menu items:
|
Shortcut menu
To open the shortcut menu, right-click on a variable in the view. The menu contains these commands:
- Ctrl+A
- Ctrl+Insert
- Ctrl+F
Use the command to define a watch expression. The selected variable is copied to the Expressions view. Watch expressions are evaluated each time a session suspends.
Icons and decorators
Icons
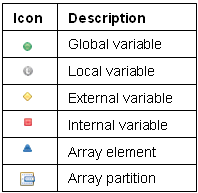
The following icons are displayed in the Variables view:

Decorators
The following decorators are used to indicate whether a variable is fixed and / or based. The decorators are displayed in the upper right corner of the variable icon.

This figure shows an example:

Limitations
Filters not correctly initialized
The filters in the Variables view ( and ) are not correctly initialized. To correct the settings, click the stack frame twice or select a variable in the Variables view.