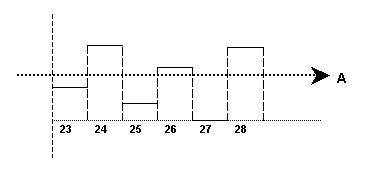
Workload control, a graphic exampleThe planning algorithm of the Work Load Control planning method can be illustrated by means of the graphics below. The planning method is described in detail in the Workload control, planning algorithm topic. In these graphics the total production volume of a number of plan items is displayed. Note This example shows the effect of capacity constraints. Material constraints are handled in exactly the same way. Step 1: Generate the non-constraint plan When no constraints are considered, LN plans the production of each item exactly when it is needed. Generally, this non-constraint plan is not feasible, because of capacity or material constraints.  Non-constraint plan
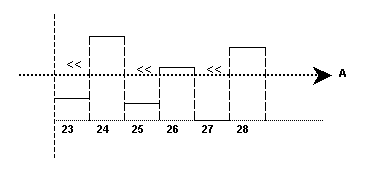
Step 2: Backward planning In week 24, 26 and 28 the required production capacity exceeds the available capacity. In a backward-planning step, part of the planned production is moved to earlier periods.  Before backward planning
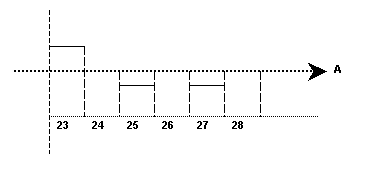
 After backward planning
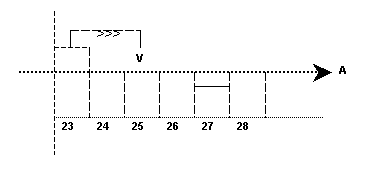
Step 3: Forward planning The excess capacity requirements in the first period of the plan cannot be moved backward any further. As a result, the desired delivery dates cannot be met. The excess production volume is moved forward, to get a plan that resembles the non-constraint plan as much as possible.  After forward planning
| |||||||||||