Using Visual Workflow
When a workflow is launched in Optiva, you can view the action steps either in a tabular format or a graphical format.
The tab and the Pending Task grid display the action steps as a tabular format.
In the tab, the steps in the action set are displayed as a flowchart.
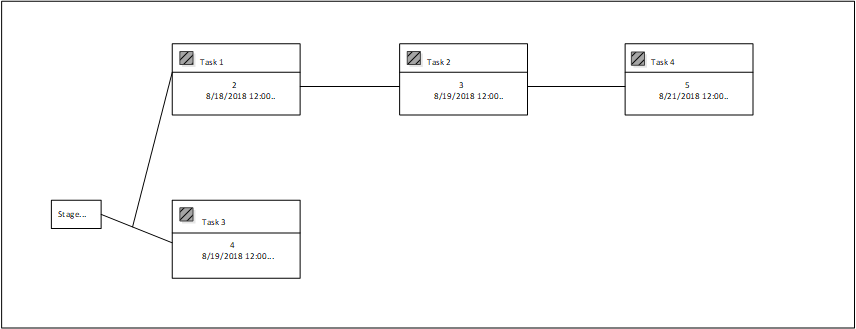
At a glance, you can see this information:
- Whether actions are performed in parallel or in sequence.
- How actions are connected to each other.
- How many steps have been completed.
- The steps that are still in-progress.
- The next step in the workflow.
- The steps that have been rejected.
The Visual Workflow tab displays the workflow steps (i.e., actions) as a node; the status is displayed for each action.
Each action has event buttons, such as , , and . These buttons are used to process the action.