Changing views in the Gantt tab
Now you can select drop list in the Project Management form to switch between the Day, Week or Month view.
The task bar is split into two colors. The default color of the top half of the bar is light grey. The top half represents the percentage of the task left to be completed. The bottom half of the bar can be green or black. If the bottom half of the bar is green, the task is in process. If the bottom half of the bar is black, the task has not started yet.
A task bar is now displayed in the Gantt chart. The bar indicates the percentage of the task left to be completed. You can click on the task bar to switch between displaying the percentage of the task left to be completed and the Start and End date.
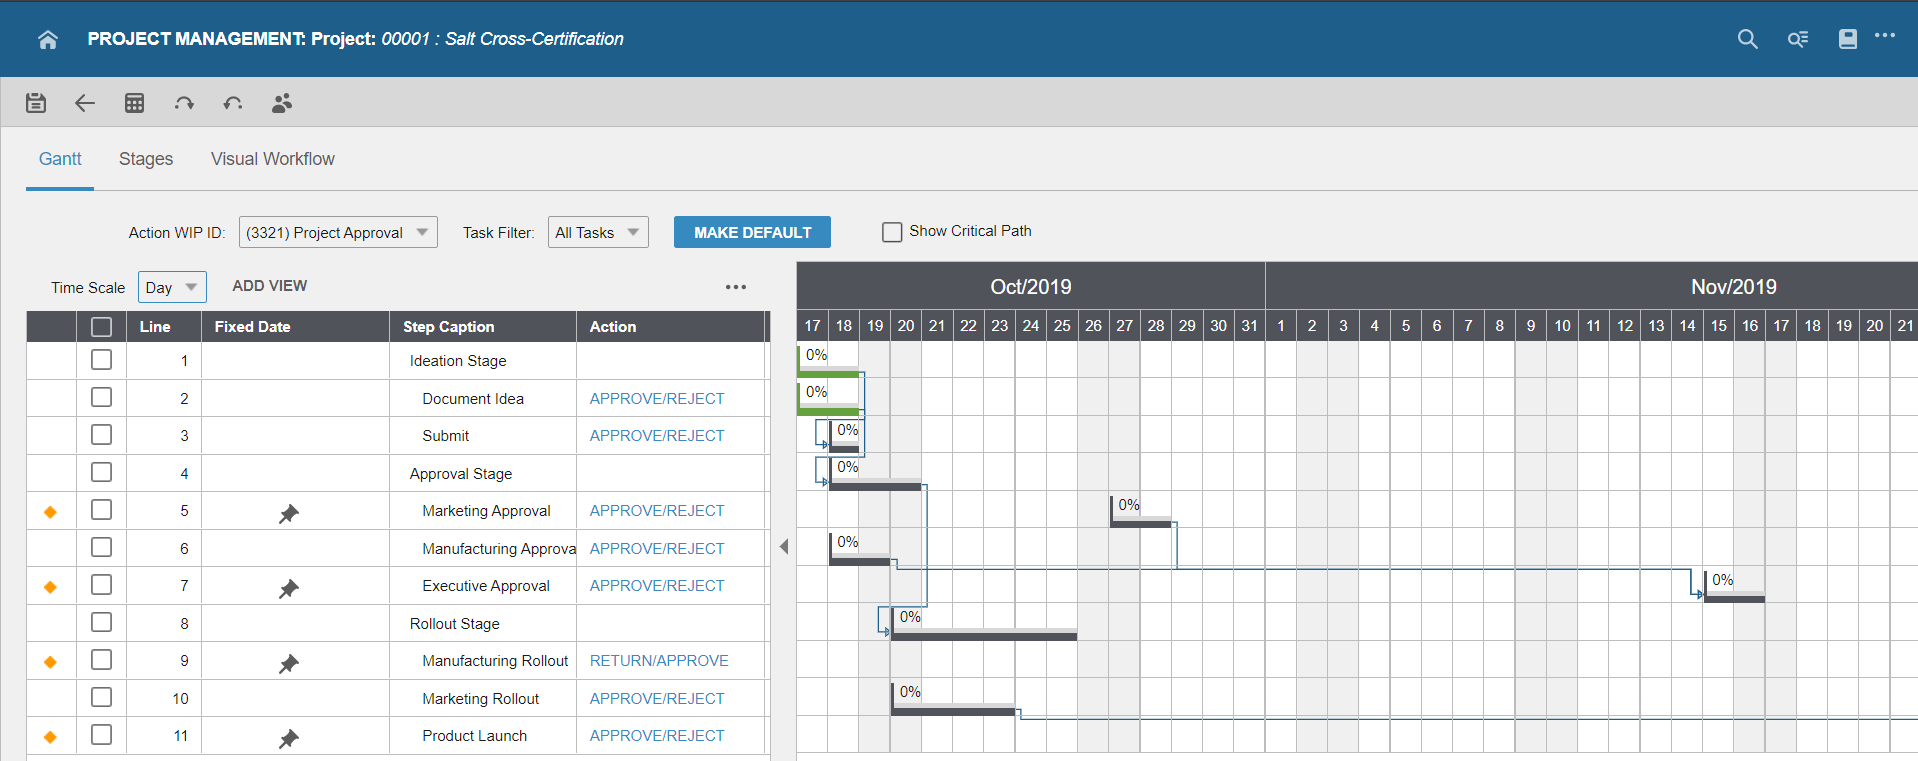
Day View
The Day view displays the Gantt chart with grey columns. These grey columns represent weekend days on the Gantt chart. The Day view is the default view when the workflow span is less than 4 weeks.
In the Day view, you can drag the task bar to change the Start and End date for a task. The date changes as you can drag the bar across the Gantt chart.
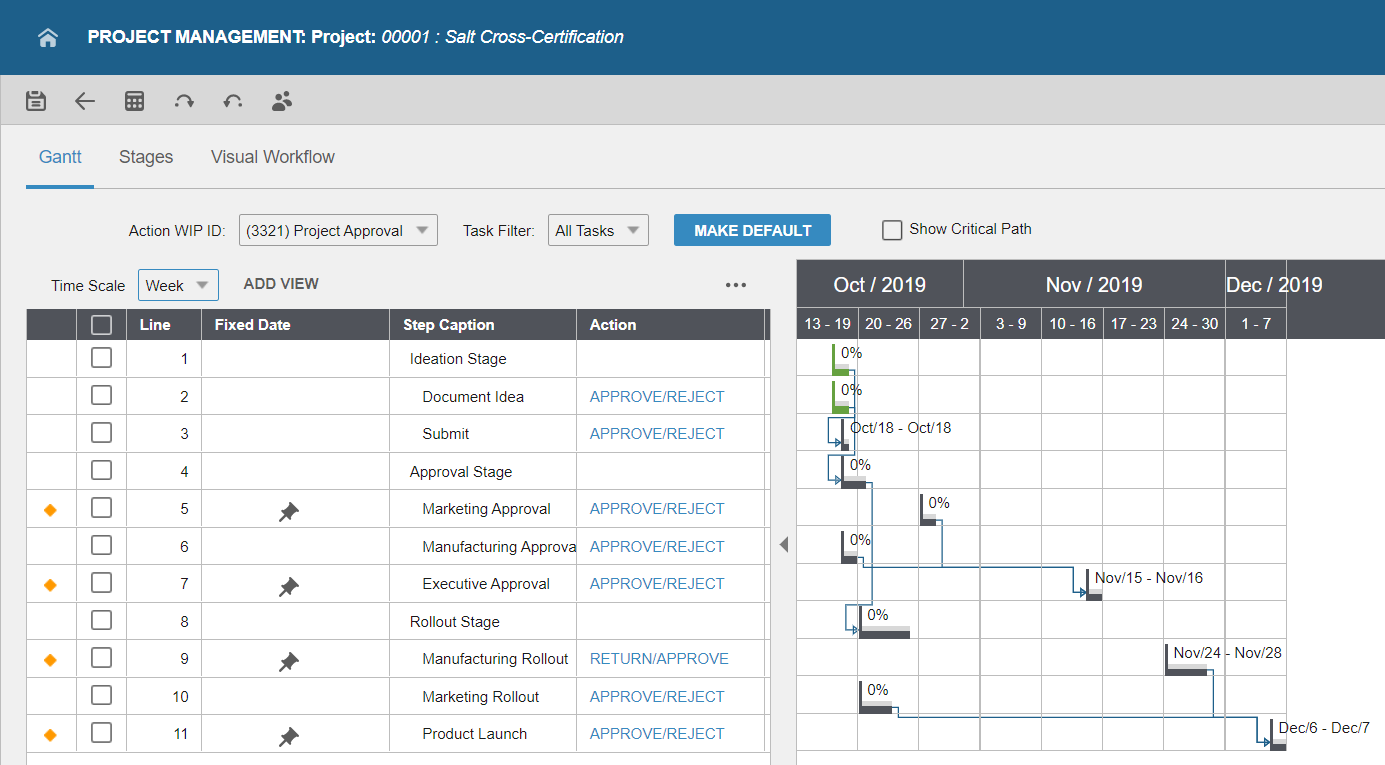
Week View
The Week view is the default view when the workflow span is 4 to 6 weeks.
In the Week view, you can drag the task bar to move the Start and End date one day at a time.
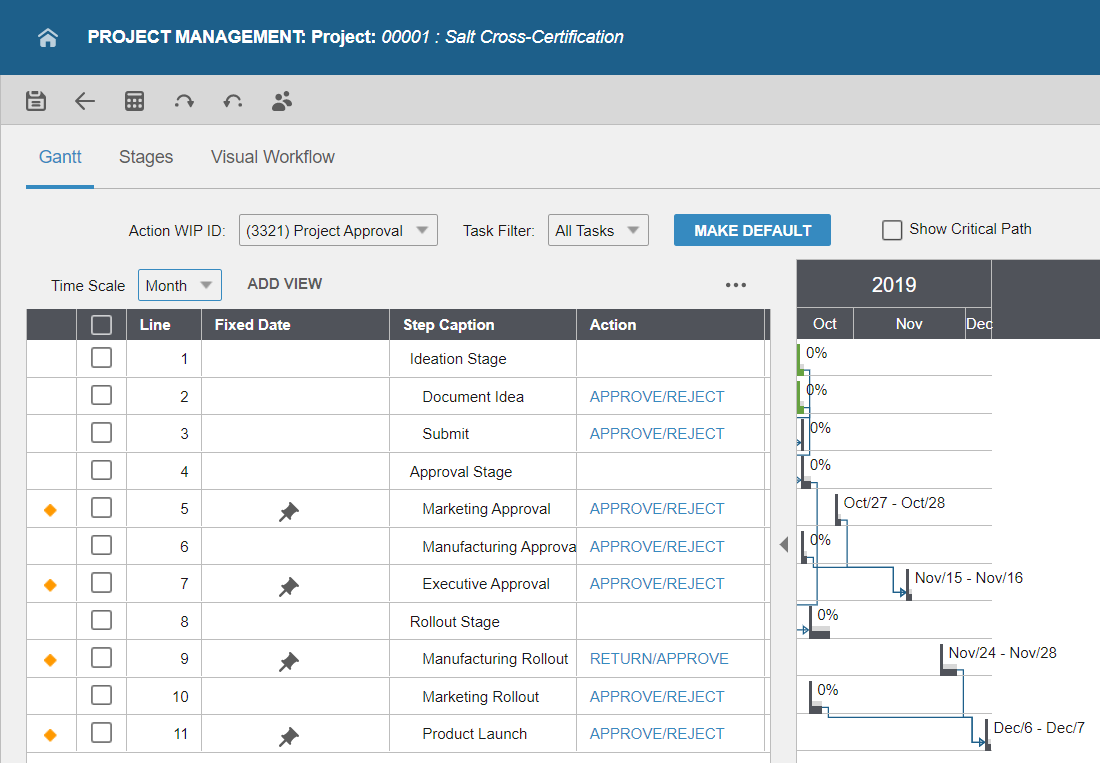
Month View
The Month view is the default view when the workflow span is more than 6 weeks.
In the Month view, you can drag the task bar to move the Start and End date one day at a time.