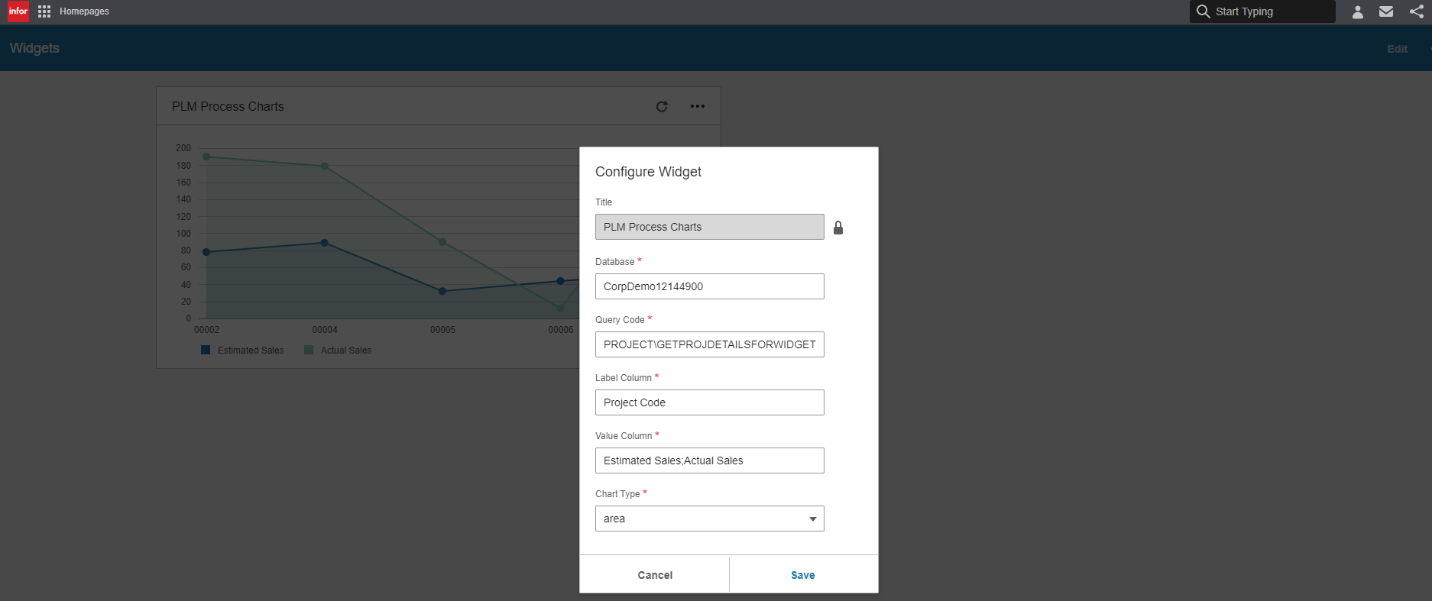
Configuring the charts widget
- Specify this information:
- Database
- Specify the database from which the use wants to retrieve data.
- Query Code
- Specify the lookup set and the lookup code in this format:
<<LookupSetname>>\<<LookupCode>>
For example, PROJECT\ GETPROJDETAILSFORWIDGETLOOKUP.
Where PROJECT is the lookup set and GETPROJDETAILSFORWIDGETLOOKUP is the lookup code.
Label Column and Value Column are the column labels shown in the Lookup Language tab in Lookup Set symbol.
- Label Column
-
Specify the name of the Label Column that is seen as a chart data label in the resultant chart.
For example, Project Code.
- Value Column
- Specify the names of the Value Column that is seen as a value names in the
resultant chart.
For example, Estimated Sales; and Actual Sales.
- Chart Type
- Select the chart type from the list of charts provided. The list
contains six types of charts: bar, pie, column, line, and area.
See Query Parameters.