Recommended label values
Recommended Label Values contain up to 14 different calculations. Some calculations use the Source area of the Analysis form as the input, and others use output from one of the other calculations.
Calc 1- Sample size
A count of the number of data points being used as the basis of an analysis. Suppose the analysis instance used parameter values from 45 test results. Only 13 test results have a value of sodium. In this example, the sample size for sodium is 13.
Calc 2 - Average
Represents the mean value of a set of parameters.
Calc 3 - Current label values
Gets the nutrition values from a tagged row from the source grid of the tab and shows them on the results grid.
Calc 4 - Proposed label value
This calculation is the primary purpose of the analysis. The inputs are the Average (Calc 2), the Rounding Rules (from the Analysis form), and the Risk Factor using Proposed Label Values (Calc 6). The Proposed Label Value is calculated as follows if the Risk Factor is > 5.
Proposed Label Value = RoundingRule(Average)
In the above equation, the Rounding Rule function is based on the parameter-specific rounding rules. The parameter-specific rounding rule is defined for the general properties on the Analysis form.
The Rounding rule essentially specifies how to round the Proposed Label Value and whether to round up or down.
The Proposed Label Value and the Risk Factor using Proposed Label Value
calculations depend on each other. One uses the other as input. The equation is
intended to iteratively calculate the Proposed Label Value to minimize the Risk
Factor. The calculation continues until the Risk Factor is less than 5, or after 50
iterations (ITURNS) have been completed.
Calc 5 - Recommended label value
An editable row where the default value comes from Calc 4 - Proposed Label Value. This give the user a way to come up with a different nutrition value than the one proposed by the system calculation.
Calc 6 - Risk factor using proposed label value
The calculation uses the Proposed Label Value as input, the Average, and Variability (Calc 12) and returns a Risk Factor. The Risk Factor is calculated according to this Equation:
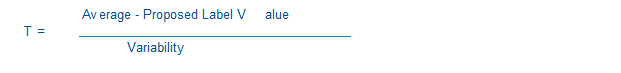
In the above equation, Average, Proposed Label Value, and Variability refer to the parameter value of the corresponding row tag. After T has been calculated, the value is compared to the t-value in a student’s t-table. This comparison uses the row for the degrees of freedom of the sample set, which is defined as Sample Size - 1.
Use that row to find the value that is closest to t, and then retrieve the Probability value, P, from the t-table. The Risk Factor is then calculated as Risk Factor = 100 - P.
Calc 7 - Risk factor using current label values
The same as above, except the Current Label Values are used instead of the Proposed Label Values.
Calc 8 - Min/Max requirements to comply with current label value
The value is calculated using this equation:
= Current Label Value * 0.8 (If Rounding rule says this is Direction = Down Nutrient)= Current Label Value * 1.2 (if Rounding rule says this is a Direction = Up Nutrient)Calc 9 - Percentage of monitored samples in compliance with current label
This calculation is based on the Percentage of samples at or below the value in Calc 8 divided by the Sample Size.
Calc 10 - Daily values
The calculation retrieves the Daily Value for this TP from the general properties of the Analysis form.
Calc 11 - Percent daily value from the proposed label value
The calculation is based on the Proposed Label Value divided by the Daily Value and is expressed as a percentage.
Calc 12 - Variability
This is the standard deviation for the sample population. This value is used as input to calculate the Risk Factor. The standard deviation is calculated as follows where n = sample size, and x are the individual parameter values.