Chart Types
The support six types of charts: bar, pie, column, line, and area. Based on the type of chart selected, the data in displayed in the widget UI. The images below are the widget UI for each chart type.
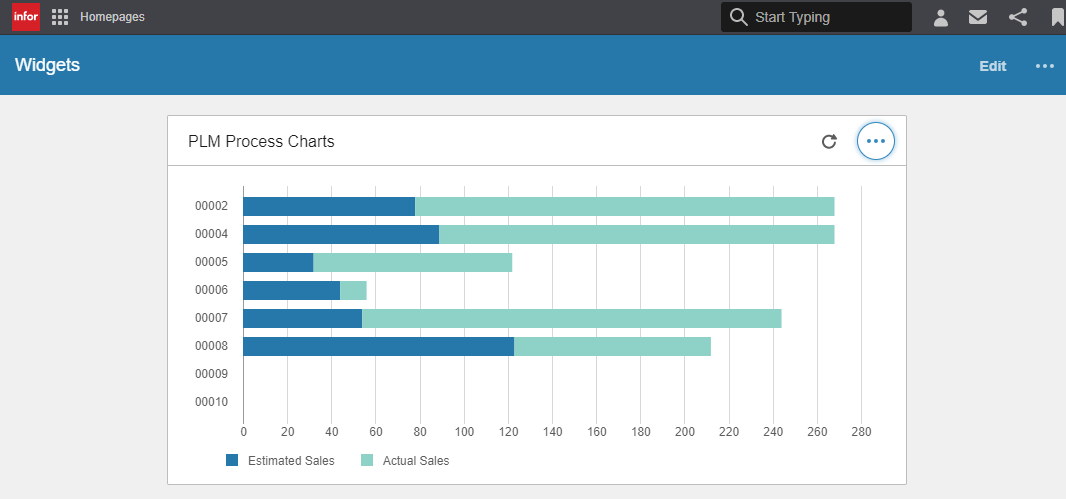
- Bar chart:
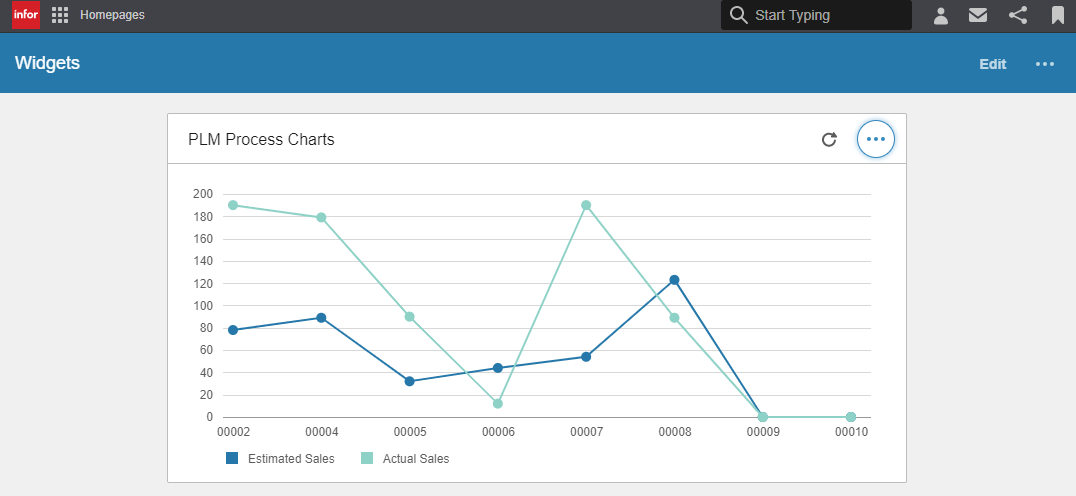
- Line chart:
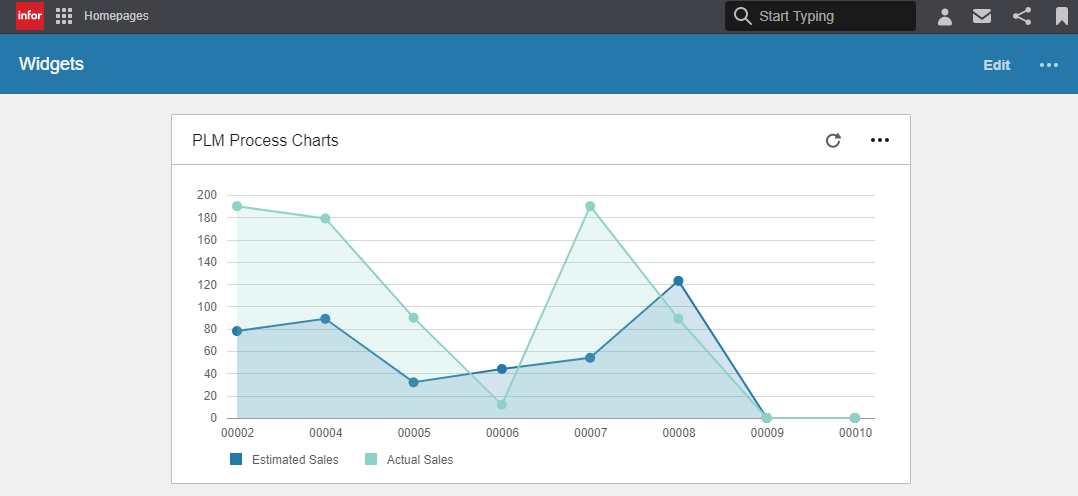
- Area chart:
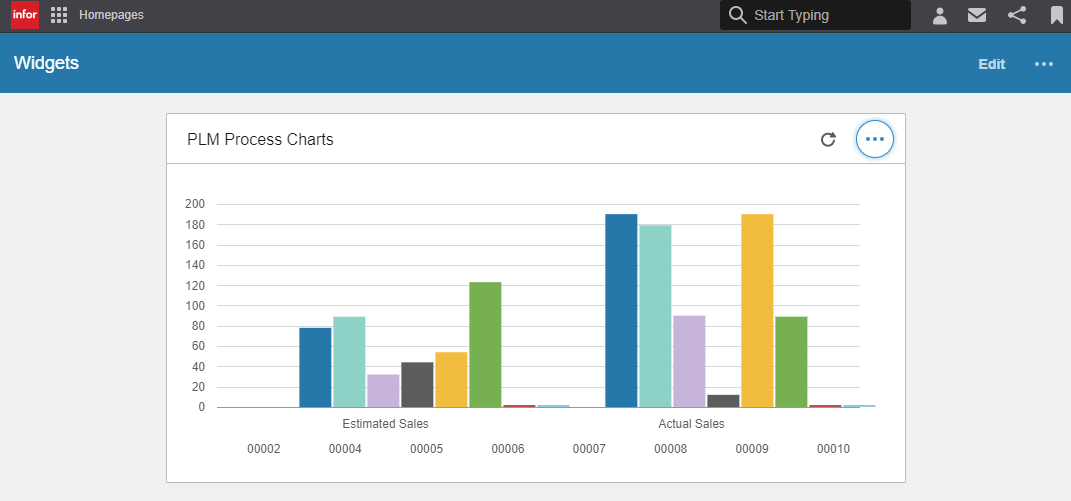
- Column chart:
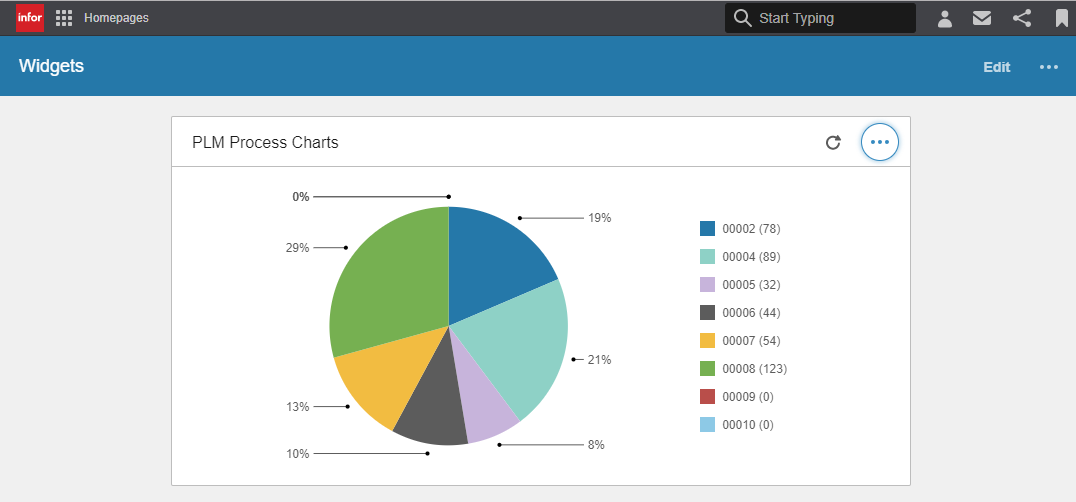
- Pie chart: