Creating a flowchart that shows your hierarchy
Draw a flowchart showing your company’s site hierarchy. Use a pencil, or use an application that lets you draw flowcharts on your computer, because you will probably change the flowchart several times. You will use the information in later chapters of this guide to help you refine your flowchart.
Example
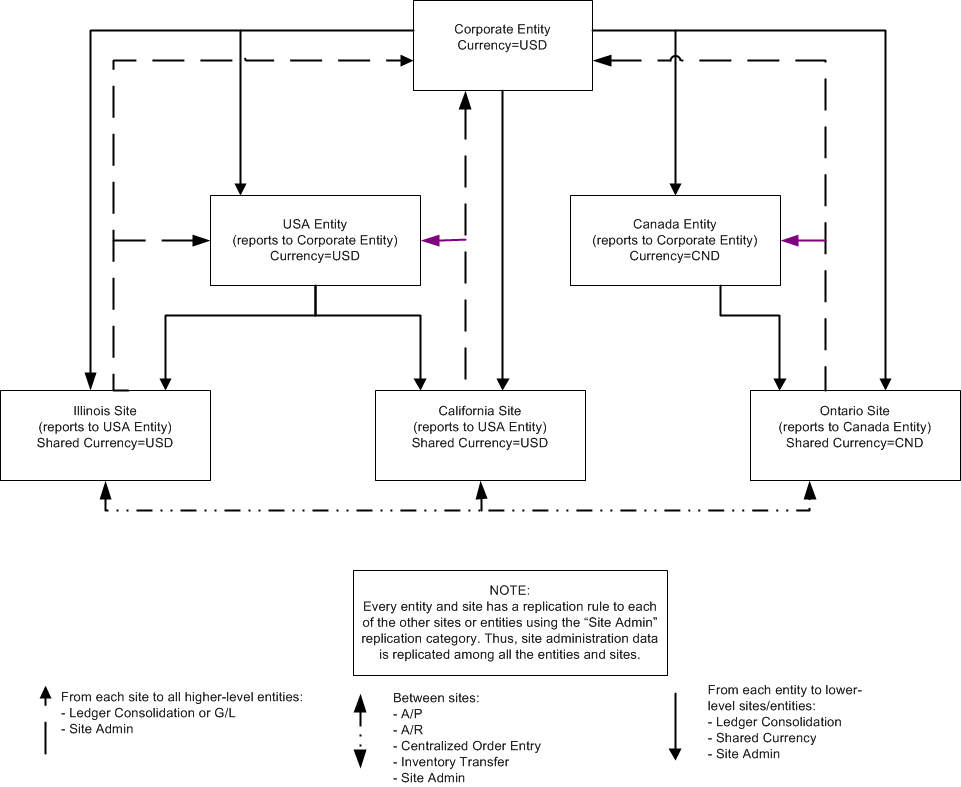
This multi-site corporation has facilities in three locations. The flowchart shows the logical structure of the company, set up as sites and entities.
Illinois Facility: This is the corporate office and the United States divisional office. It has a warehouse for shipping and receiving. Orders shipped from this site are invoiced from this site. This facility also processes all sales orders, receivables and payables for the other two sites.
California Facility: The California facility has a warehouse for shipping and receiving. Orders shipped from this site are invoiced from this site. One product line is sourced at this location from a Mexican vendor.
Ontario Facility: The Ontario facility is the Canada divisional office and has a warehouse for shipping and receiving. Orders shipped from this site are invoiced from this site. A product line from this location is sourced from a Canadian vendor.
The arrows show how different categories of data would flow between the sites and entities at this example company. Do not be concerned with the arrows yet, although you may want to include some possible data flows.
Categories will be explained later. See Sharing data between sites.
