Example plan
This simple example illustrates how the Planner processes a set of data and generates a plan from a set of orders. This example facility manufactures tables and chairs..
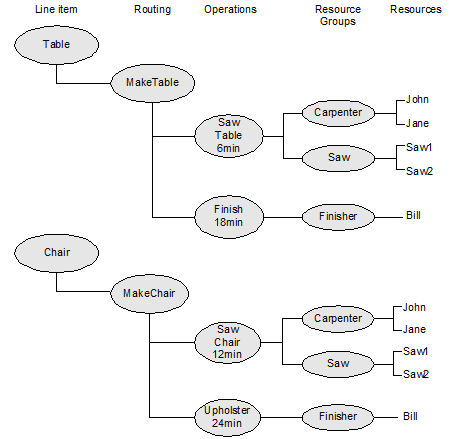
| Item | Operation 1 | Operation 2 |
|---|---|---|
| Table | SawTable | Finish |
| Chair | SawChair | Upholster |
These operations each require certain resource groups. They have cycle times of 6, 12, 18, and 24 minutes per item, as shown below.
Each resource has a shift that defines its available time. They are each available from 9:00 a.m. to 6:00 p.m. with a 1-hour break for lunch and maintenance. For simplicity, the shifts are defined as 9-5 instead of breaking an 8-5 shift for a 1-hour break.
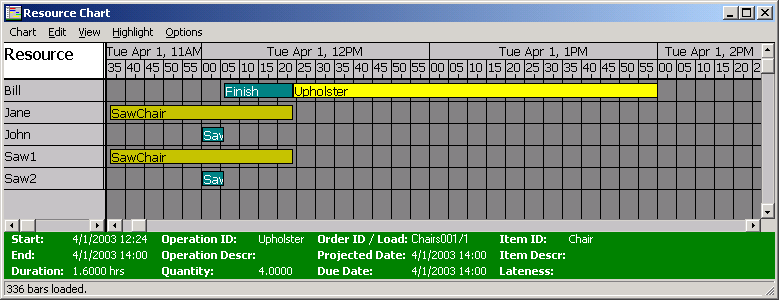
Gantt Chart View
The screen below from the Gantt Chart screen in the APS Analyzer shows how the system allocated the resources to each operation. There are currently two orders in the system, each with a single line item:
| Order | Quantity | Due Date |
|---|---|---|
| Chairs001 | 4 | 4/1/2003 14:00 |
| Tables001 | 1 | 4/1/2003 14:00 |
The current date/time is 3/31/2003 at 9:00 a.m.
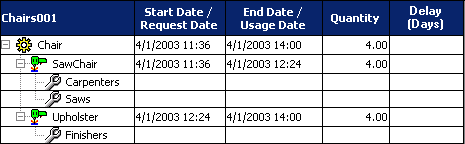
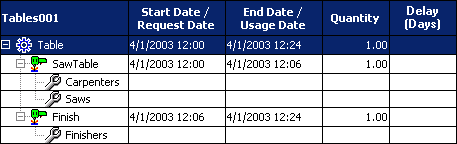
A pull plan for a 14:00 requested completion time promises 14:00 for order 1, as shown below. Operations are backward planned from the due date of 2:00 p.m. (14:00) on 4/1/2003. The order Chairs001 completes just in time at 14:00. The order Tables001 completes around 12:24, to avoid a resource collision at the finish area.
In summary, the system planned each order in reverse routing sequence, looking for available resources to be able to plan all the operations between the due date and the current date.
Order Details View
In the Analyzer’s Order Details view, you can view the details of how the system planned the two orders: