Warehouse Transfer Analysis dashboard
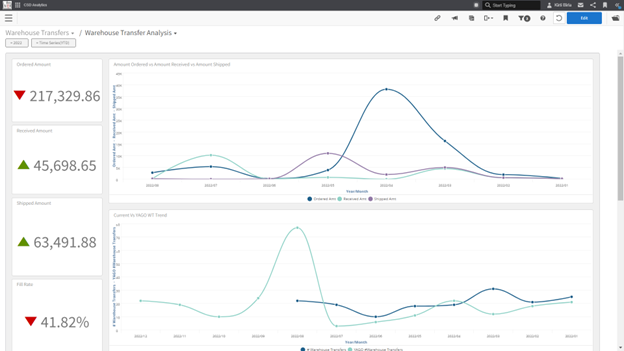
The Warehouse Transfer Analysis dashboard consists of these KPIs:
- Ordered Amount
- Received Amount
- Shipped Amount
- Fill Rate
Note: The arrow trend indicators in this dashboard compare the current year to date (YTD) with the last YTD. If a filter is changed to another year, then the KPI values and trend indicators compare the selected year to its previous year.
Reports:
- Amount Ordered vs Amount Received vs Amount Shipped
- Current vs YAGO WT Trend
Filters:
- (Default value = current year)
- (Default value = Time Series (YTD))