Inventory Control Analysis dashboard
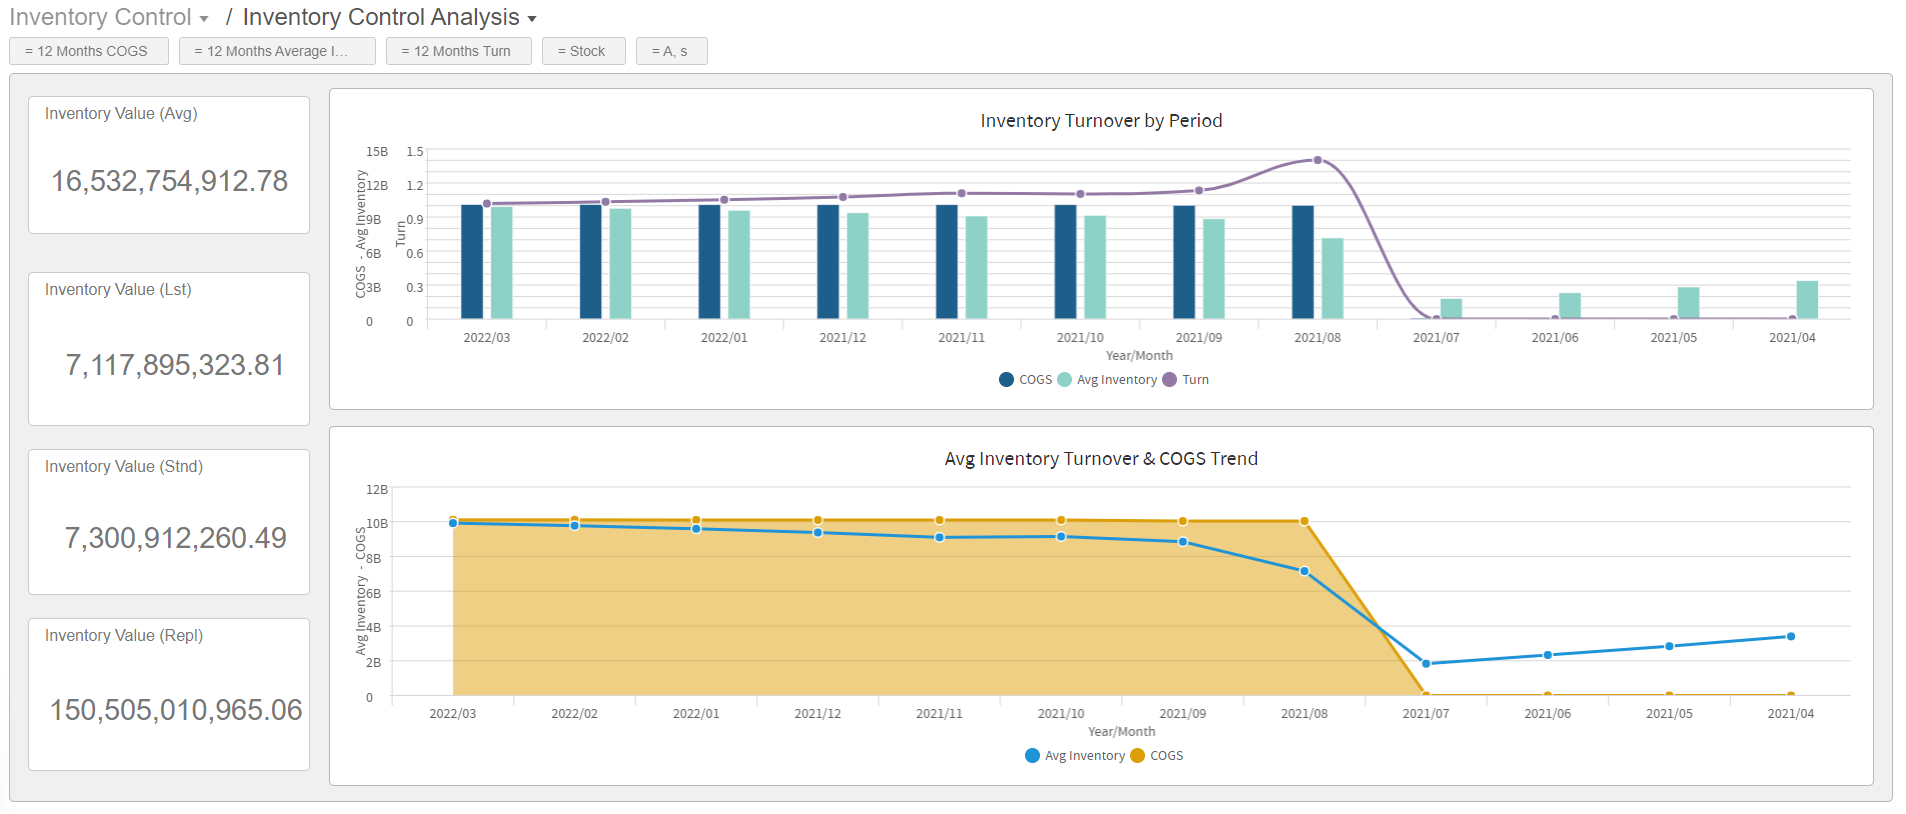
The Inventory Control Analysis dashboard consists of these KPIs:
- Inventory Value (Avg)
- Inventory Value (Lst)
- Inventory Value (Std)
- Inventory Value (Repl)
Reports:
- Inventory Turnover by Period
- Average Inventory Turnover & Cost of Goods Sold Trend
Filters:
- (Default value = 12 months Cost of Goods Sold)
- (Default value = 12 months average)
- (Default value = 12 Months Turn)
- (Default value = Stock)
- (Default value = ‘A’,’S’)