Sales Analysis dashboard
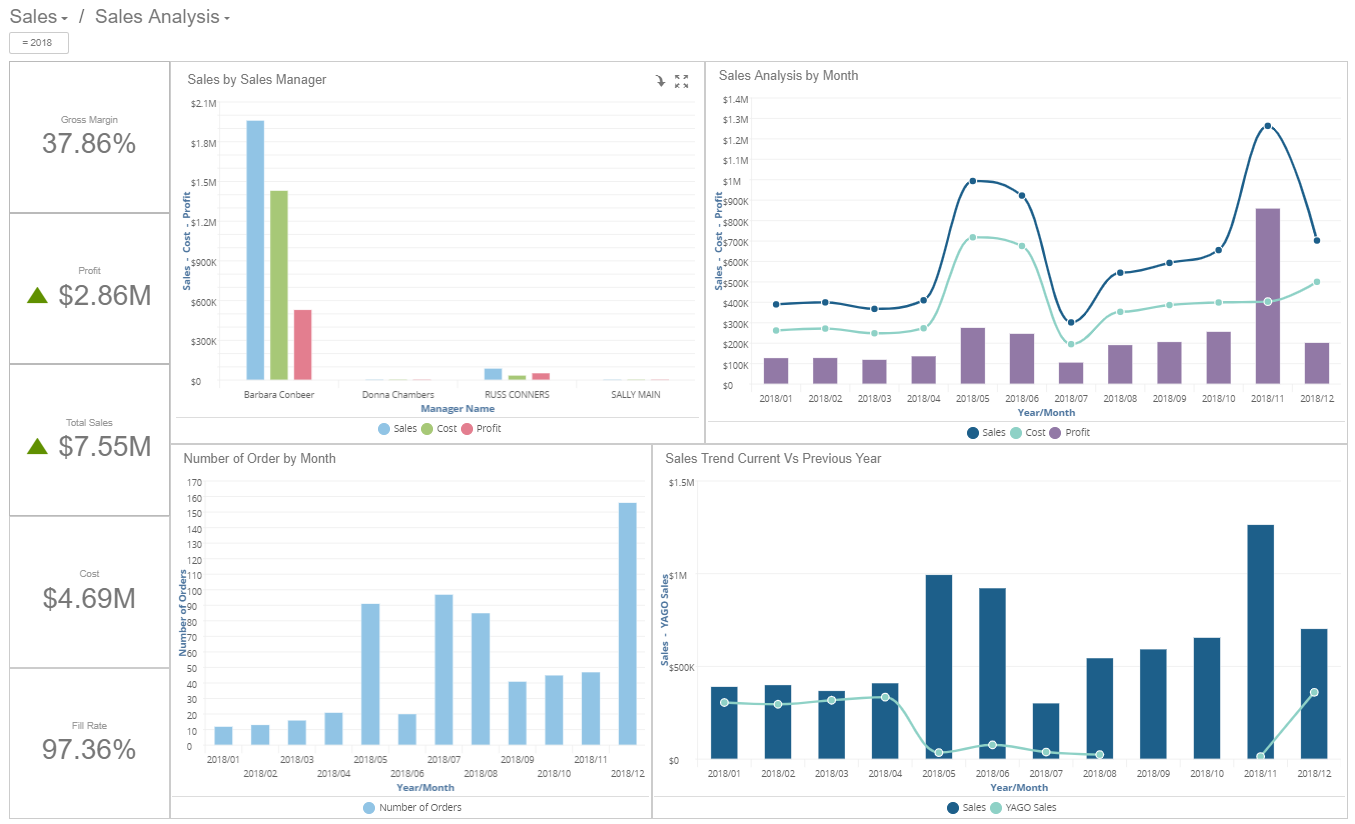
The Sales Analysis dashboard includes KPIs for these metrics:
- Gross Margin
- Total Profit
- Total Sales
- Cost
- Fill Rate
Note: The arrow trend indicators in this dashboard compare the current
year to date (YTD) with the last YTD. If a filter is changed to another year, then the KPI
values and trend indicators compare the selected year to its previous year.
Reports:
- Sales by Sales Manager
- Sales Analysis by Month
- Number of Orders Trend Current vs Previous Year
- Sales Trend Current vs Previous Year
You can filter the data with these standard filters:
- (Default value = Invoiced, Paid)
- (Default value = Current Year)
- (Default value <> c)