AP Analysis dashboard
The AP Analysis dashboard includes several Key Performance Indicators (KPI), charts, filters, and reports.
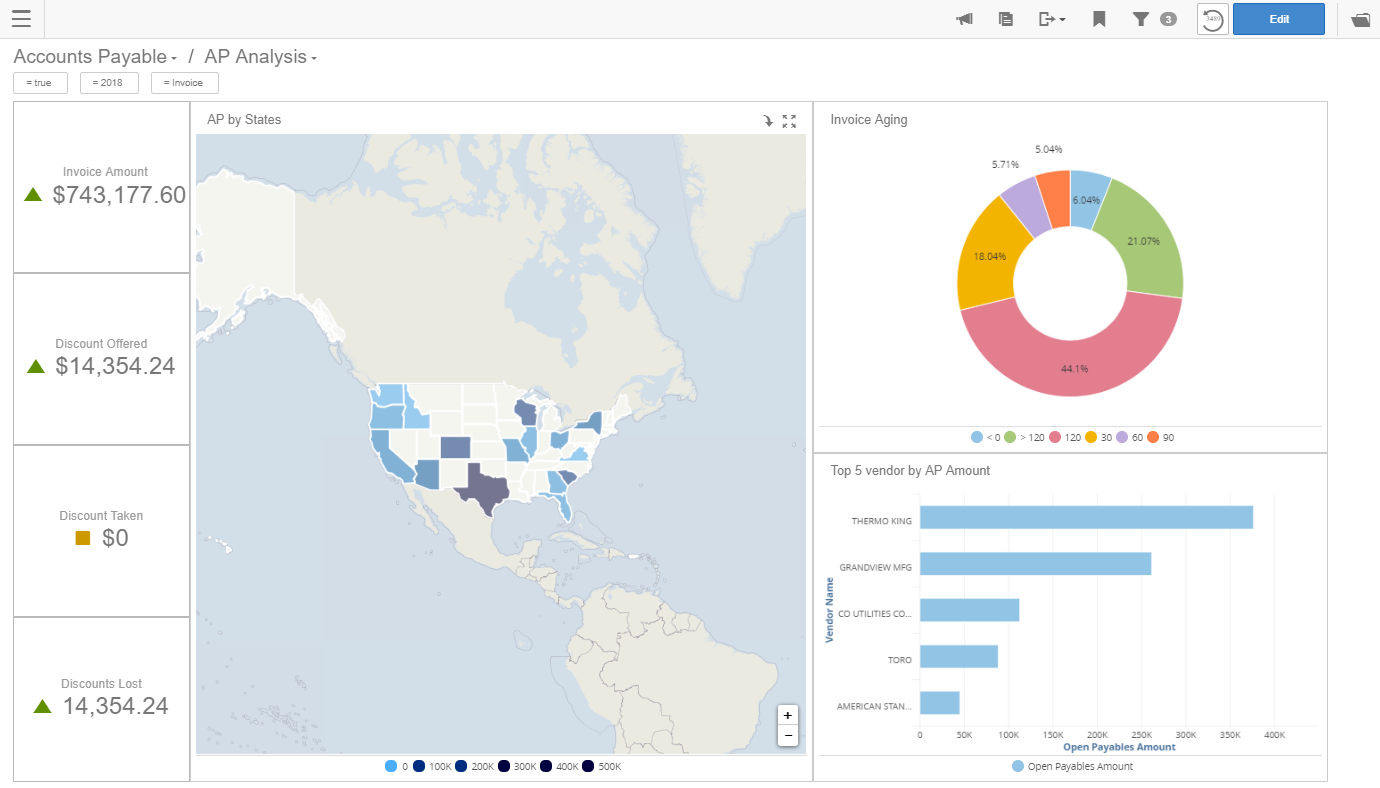
The dashboard consists of KPIs for these metrics:
- Invoice Amount
- Discount Offered
- Discount Taken
- Discounts Lost
Note: The arrow trend indicators in this dashboard compare the current
year to date (YTD) with the last YTD. If a filter is changed to another year, then the KPI
values and trend indicators compare the selected year to its previous year.
Charts are available to illustrate these metrics:
- AP by State
- Invoice Aging
- Top 5 Vendors by AP Balance
These filters can be applied in certain data points:
- (Default value = true)
- (Default value = Current Year)
- (Default value = Invoice)