AR Interactive Mix dashboard
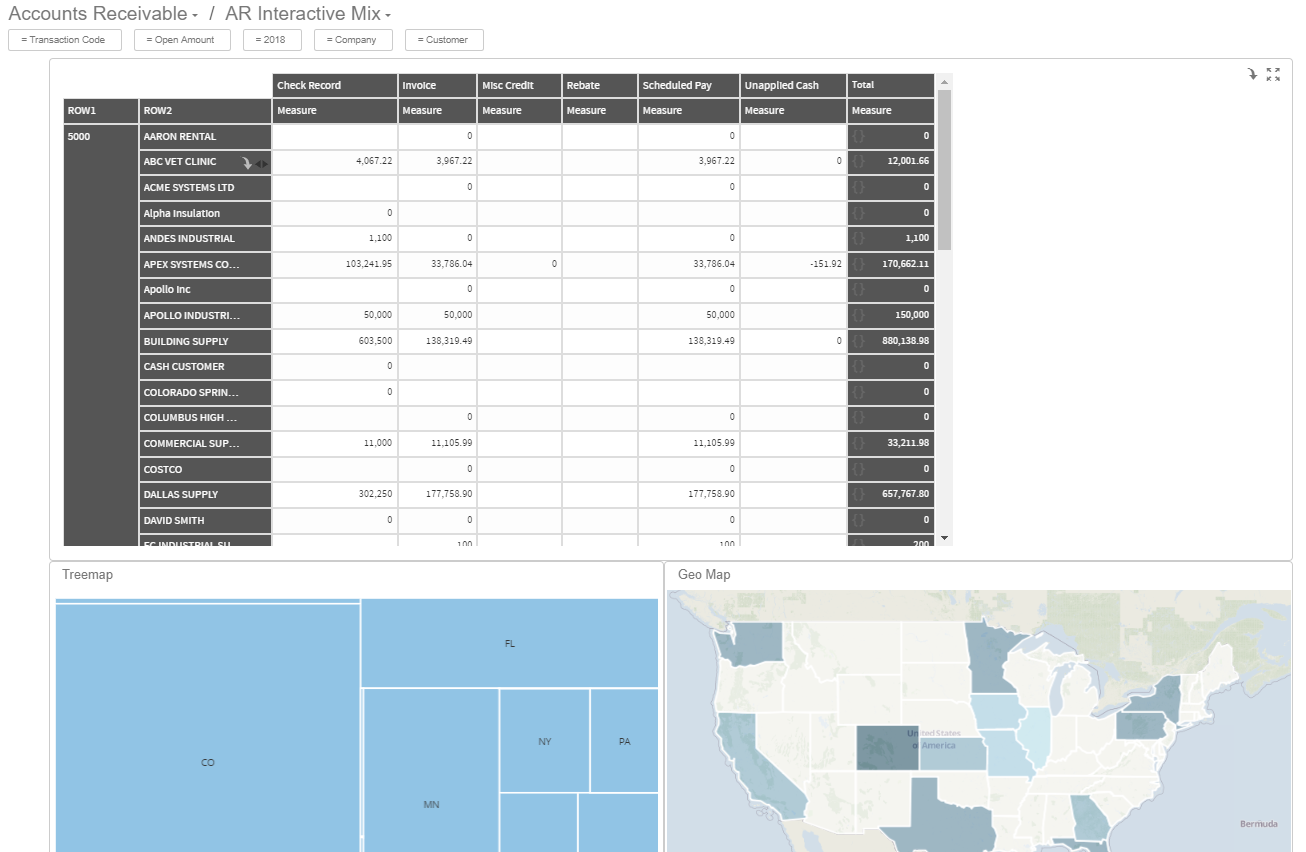
The AR Interactive Mix dashboard consists of these reports:
- Cross Tab Report
- AR Tree Map
- AR Geo Map
- AR Heat Map
- Mix Table Column Chart
Filters:
- (Default value = Company)
- (Default value = Customer)
- (Default value = Current year)
- (Default value = Open Amount)
- (Default value = Year)