Sales and Receivable Analysis dashboard
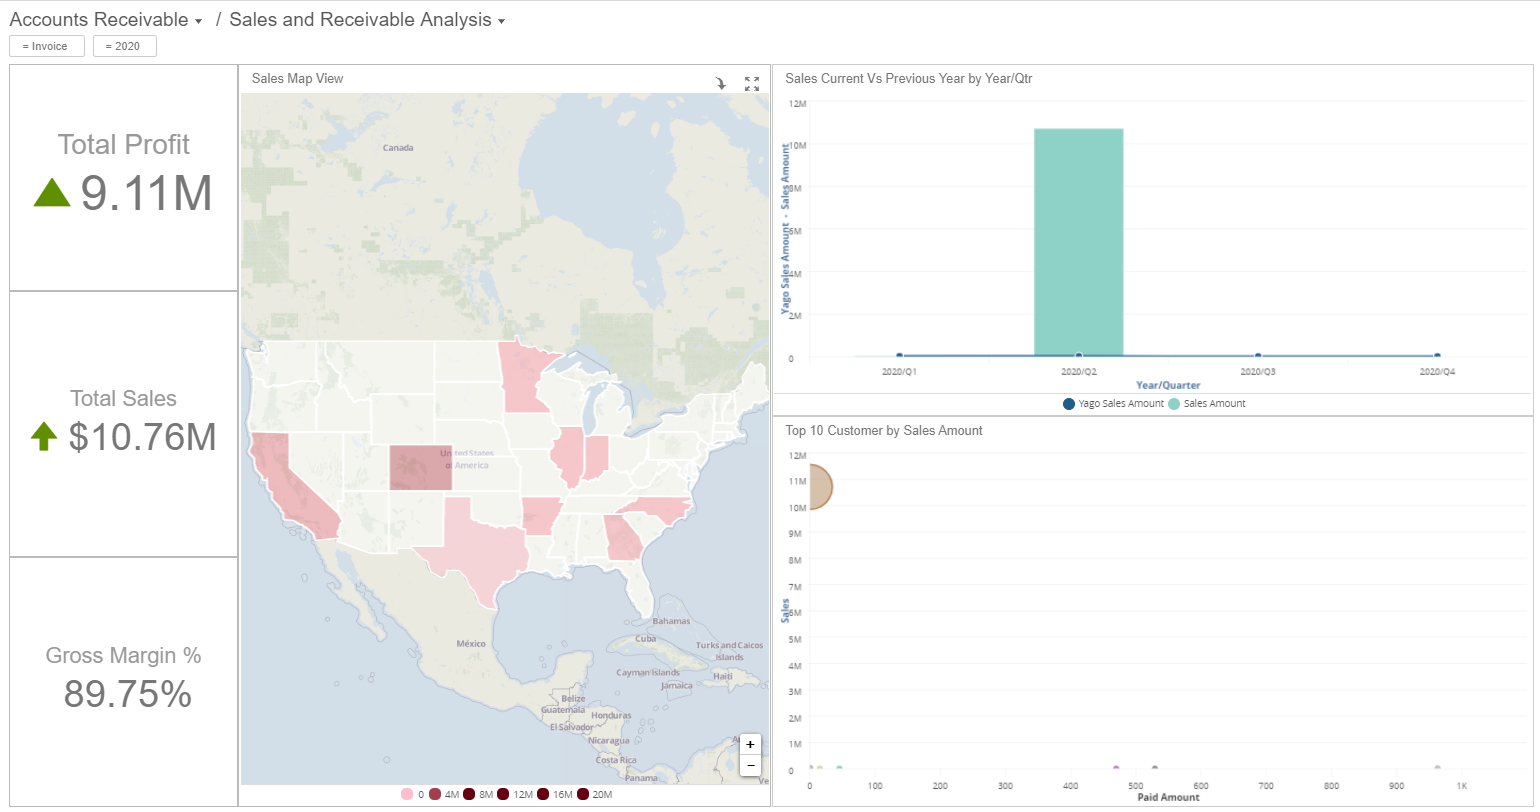
The Sales and Receivable Analysis dashboard consists of these KPIs:
- Total Profit
- Total Sales
- Gross Margin %
Note: The arrow trend indicators in this dashboard compare the current
year to date (YTD) with the last YTD. If a filter is changed to another year, then the KPI
values and trend indicators compare the selected year to its previous year.
Reports:
- Sales Map View
- Sales Trend
- Top 10 Customer Sales Amount
Filters:
- (Default value = Invoice)
- (Default value = Current Year)