Inventory Turnover Analysis dashboard
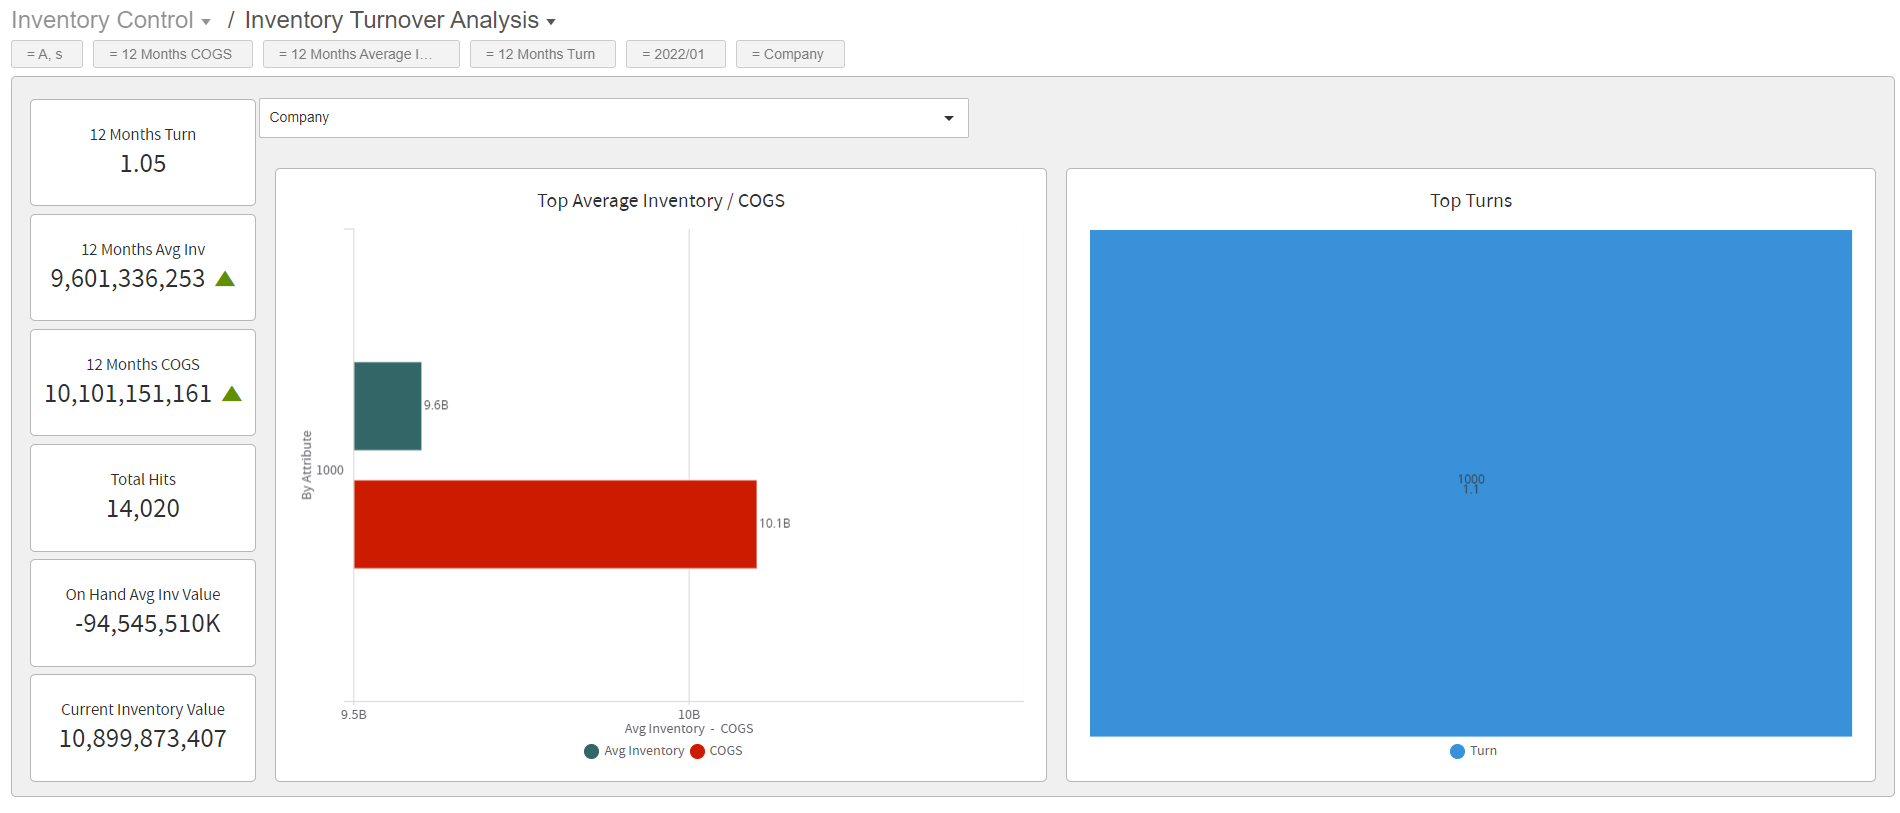
The Inventory Turnover Analysis dashboard consists of these KPIs:
- 12 Months Turn
- 12 Months Average Inventory
- 12 Month Cost of Goods Sold
- Total Hits
- On Hand Average Inventory Value
- Current Inventory Value
Reports:
- Top Average Inventory / Cost of Goods Sold
- Top Turns
Filters:
- (Default value = Stock)
- (Default Value = ‘A’,’S’)
- (Default value = 12 Months’ Cost of Goods Sold)
- (Default value = 12 Months’ Average Inventory)
- (Default value = 12 Months’ Turn)
- (Default value = Current Year/Month)
- (Default value = Company)