AR dashboard
The AR dashboard includes several Key Performance Indicators (KPI), charts, filters, and reports.
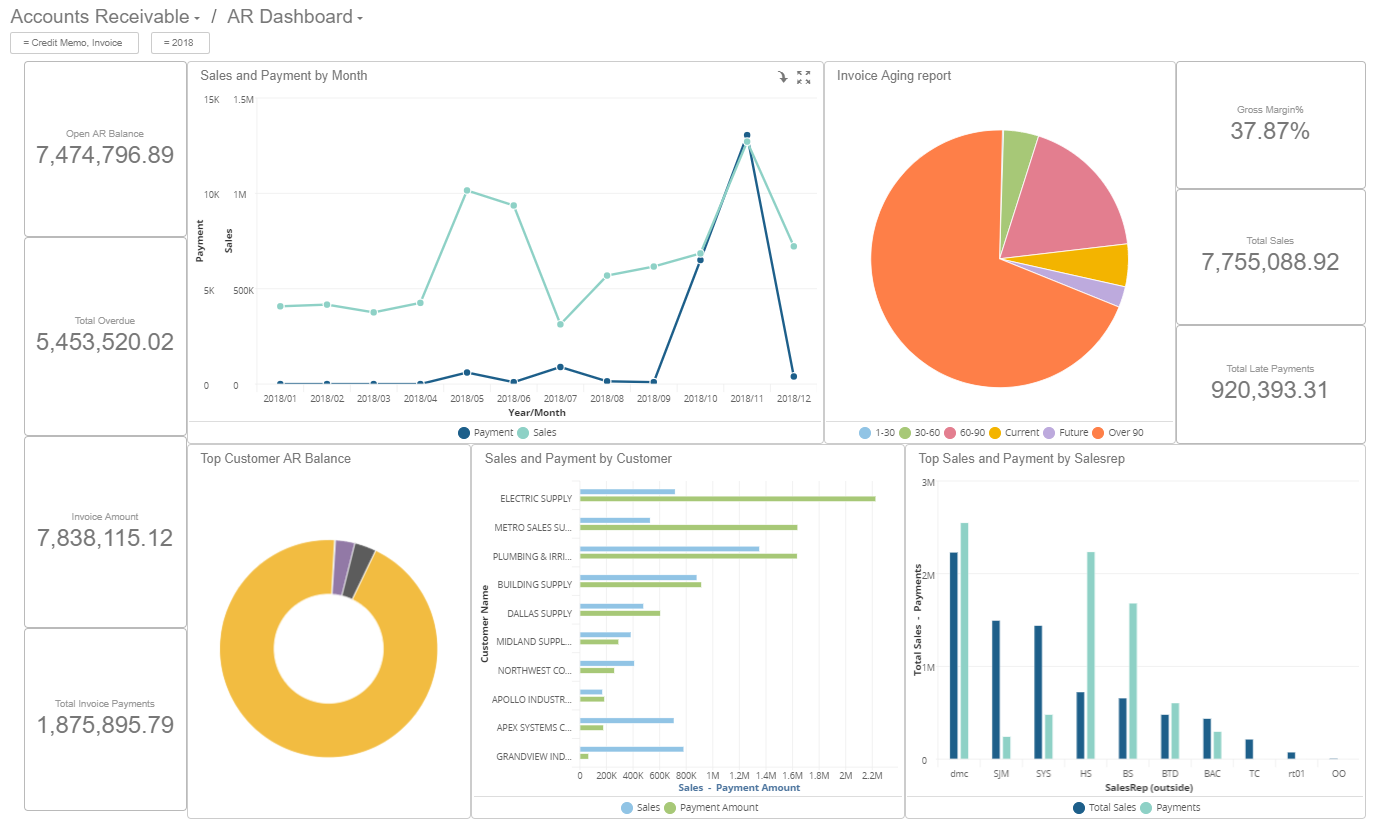
The AR dashboard consists of KPIs for these metrics:
- Open AR Balance
- Total Overdue
- Invoice Amount
- Total Invoice Payments
- Gross Margin Percentage
- Total Sales
- Total Late Payments
Note: The arrow trend indicators in this dashboard compare the current
year to date (YTD) with the last YTD. If a filter is changed to another year, then the KPI
values and trend indicators compare the selected year to its previous year.
Reports:
- Sales and Payments by Month
- Invoice Aging Report
- Top Customer AR Balance
- Sales and Payments by Customer
- Top Sales and Payments by Salesrep
Filters:
- (Default value = Current Year)
- (Default value = Company)
- (Default value = Customer)
- (Default value = Sales)
- (Default value = Cost)
- (Default value = Invoice)